


Bitcoin is entering a new macro phase after quantitative tightening (QT) officially ended yesterday, according to Crypto Rover’s latest chart update.
The shift marks a critical moment for risk assets, as Bitcoin has historically delivered some of its strongest multi-year gains during periods of quantitative easing (QE).
QE And QT Cycles Show Clear Performance Divergence
The chart highlights Bitcoin’s long-term trend overlaid with alternating green and red macro zones. The green regions represent QE phases, while the red segments indicate periods of QT. The pattern is consistent: Bitcoin’s most aggressive expansions occurred during QE, while QT phases typically coincided with slower growth or extended consolidation.
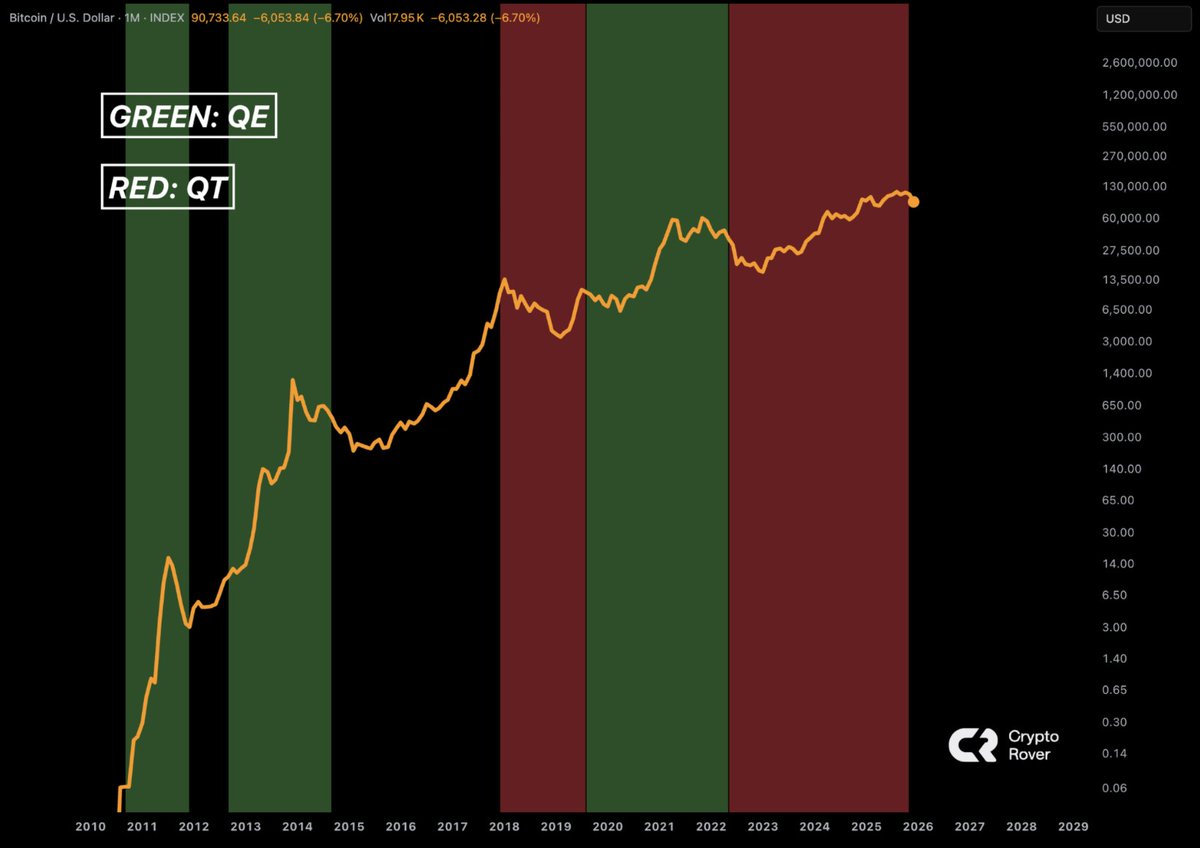
The visualization reveals how each QE cycle aligned with renewed upside momentum, beginning with the early acceleration around 2012, the major run between 2016 and 2017, and the recovery phases that followed liquidity injections in subsequent years. In contrast, the red QT segments show flatter performance curves, reflecting tighter liquidity and reduced speculative appetite.
End Of QT Opens A Fresh Liquidity Window
The return to a QE-style environment suggests that broader liquidity conditions may be shifting in Bitcoin’s favor. The chart indicates that the latest QT stretch covered much of 2022–2025, a period marked by macro tightening, elevated rates, and constrained flows into risk assets.
With QT now concluded, Bitcoin enters a macro regime historically associated with stronger price performance. While the chart does not forecast outcomes, it clearly maps how Bitcoin reacted in earlier liquidity cycles, and each time QE dominated, the long-term trend steepened.
Why This Macro Shift Matters For Bitcoin
Liquidity cycles often define the backdrop for major crypto market transitions. QE periods expand balance sheets, improve risk sentiment, and increase the capital available for higher-volatility assets. QT does the opposite.
Bitcoin’s price path in the visualization reinforces that dynamic:
-
QE phases show pronounced upward slope and accelerating adoption.
-
QT phases show more muted and uneven progress.
The data highlights how closely Bitcoin has historically responded to liquidity policy, making the end of QT a development that traders and institutions are likely to watch closely.
A Macro Reset Arrives As Bitcoin Trades Near Record Levels
This transition lands at a time when Bitcoin is already trading near all-time highs in several long-term indexes. The combination of structural halving effects, ETF-driven demand, and a potential return to liquidity expansion creates a macro environment unlike previous cycles.
Crypto Rover’s chart underscores one message: Bitcoin has historically thrived when liquidity expands, and the conclusion of QT marks the first step toward that possibility.
Bitcoin now moves into a phase defined by conditions that have historically favored upside acceleration, setting the stage for a closely watched macro reset heading into the next leg of the cycle.


