


Bitcoin is trading around $68,500 on the one-hour chart, up 0.33% on the hour after a volatile two-day window. The chart covering March 21 through the morning of March 23 shows the full sequence clearly.
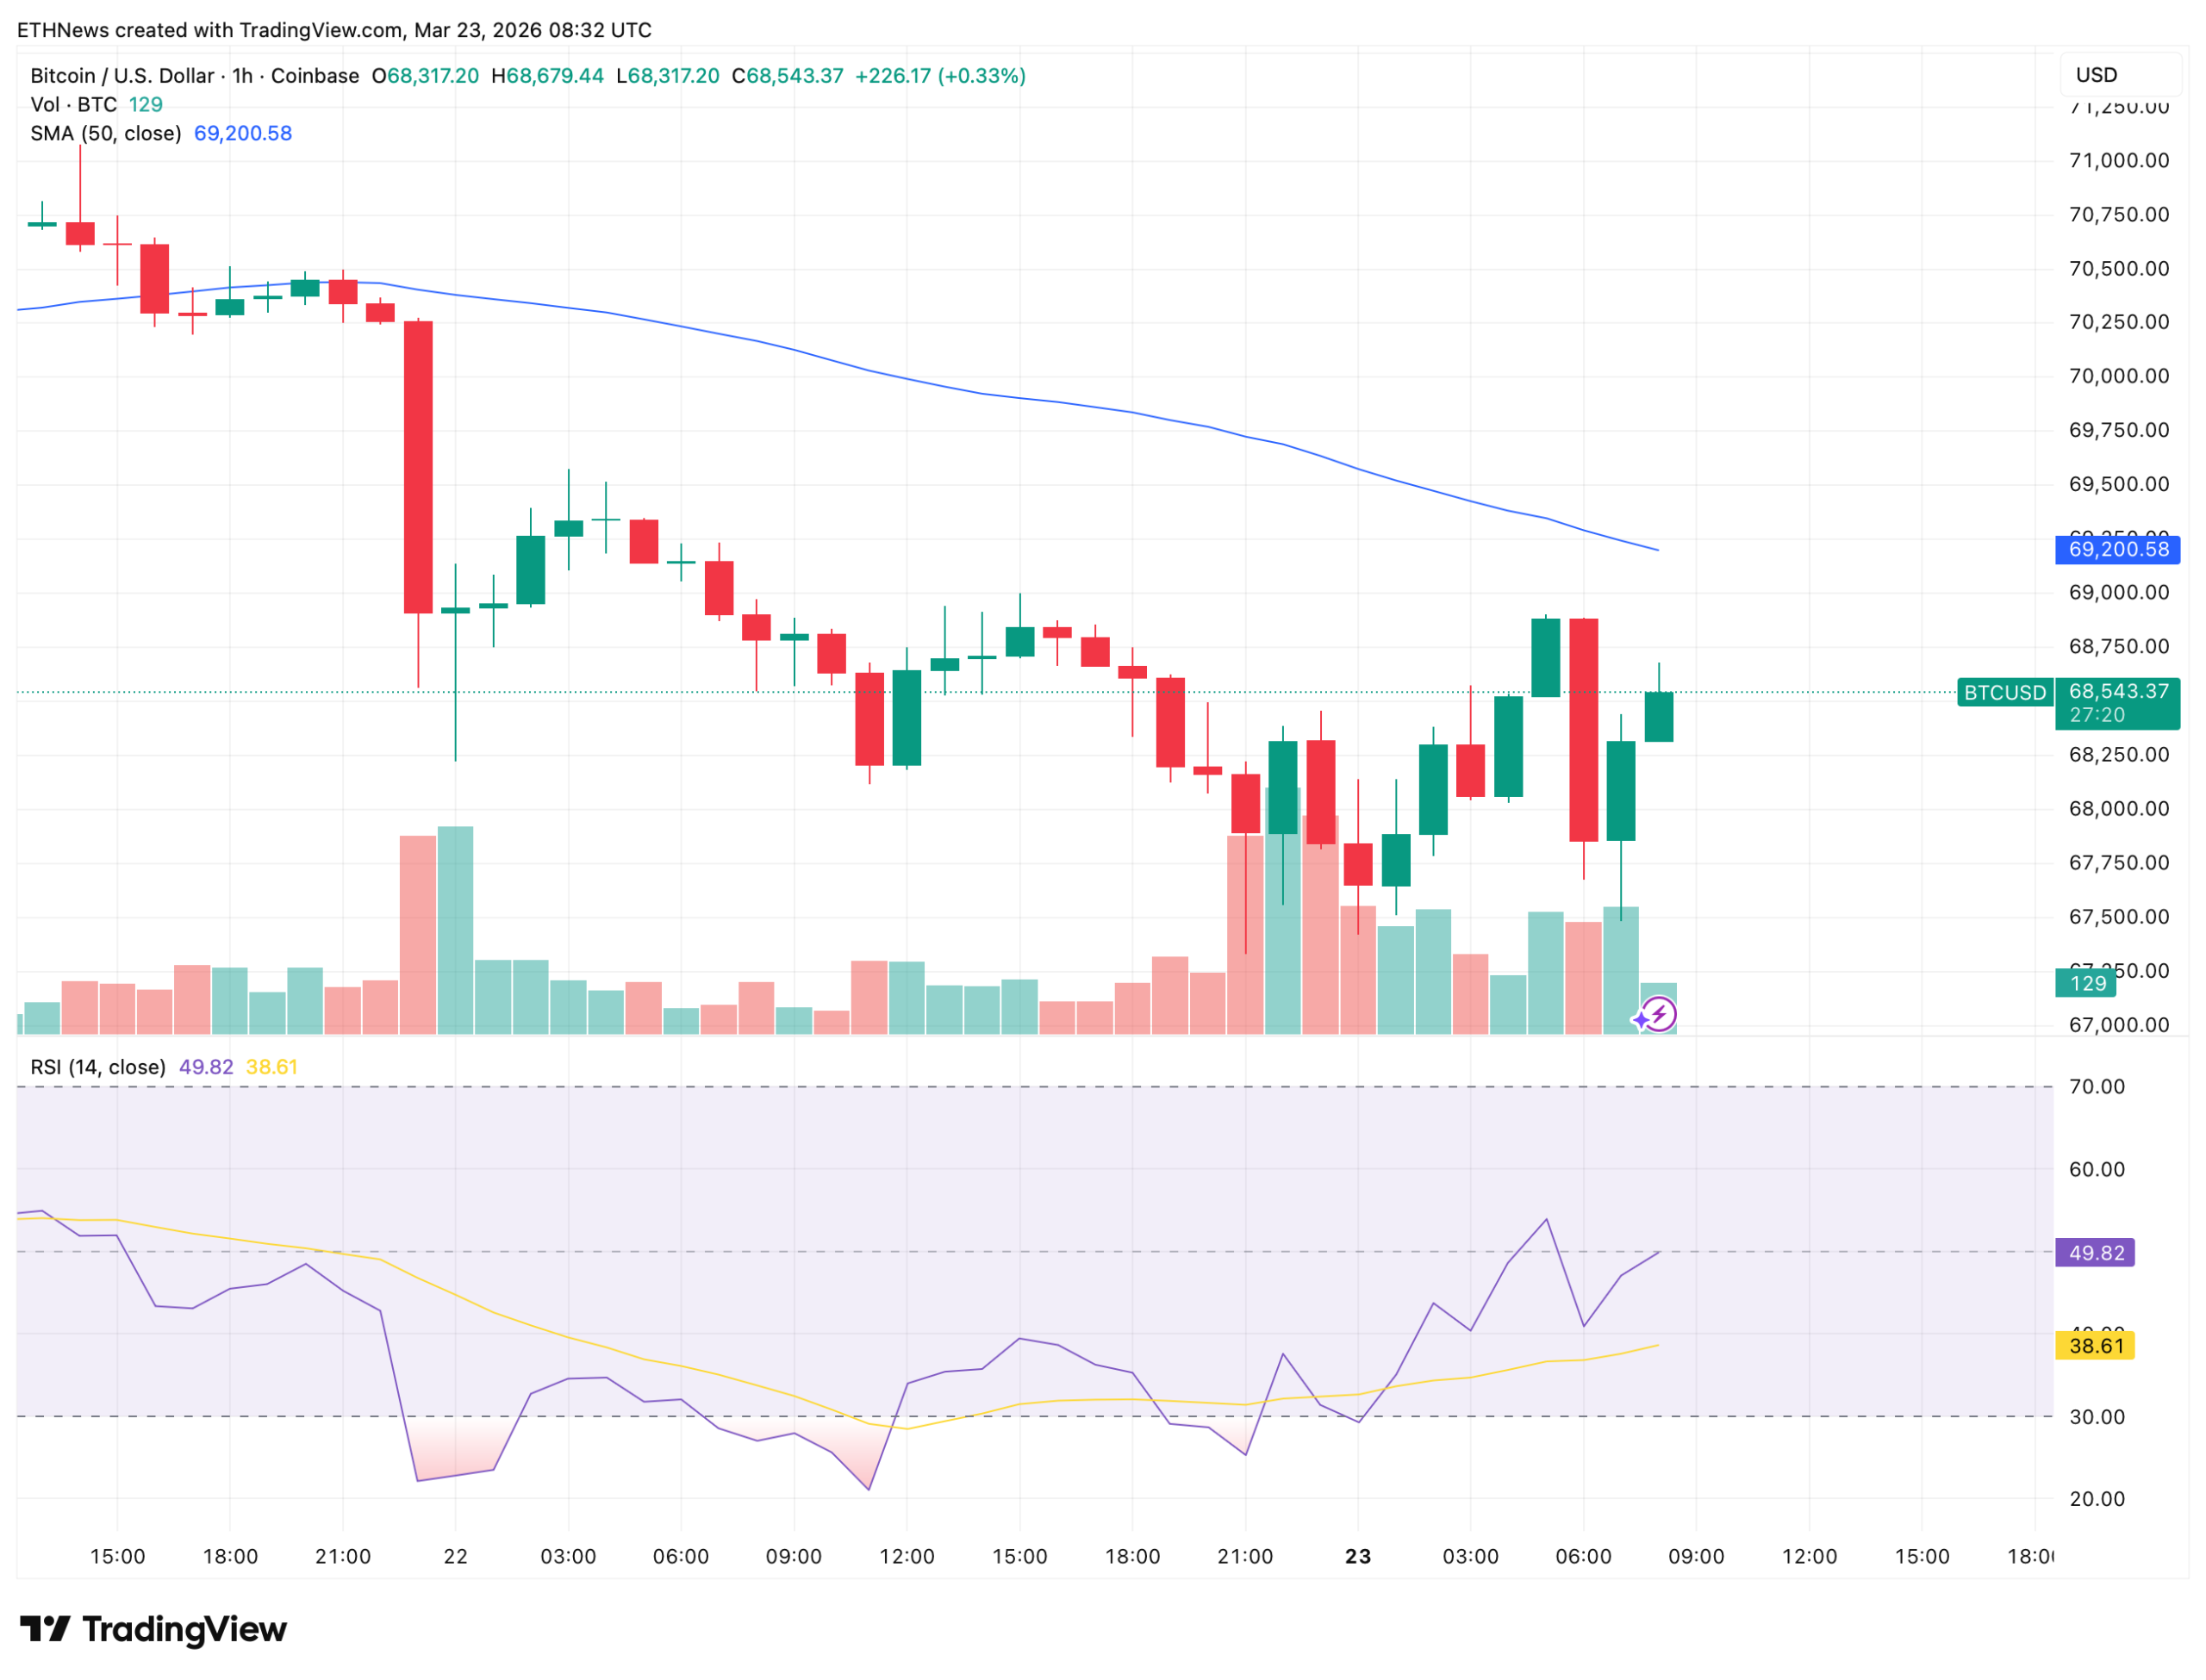
Price spent Saturday consolidating between $70,500 and $70,750 before the single large breakdown candle on Saturday evening drove it to the session low near $68,000. The post-breakdown hours produced a choppy, directionless range between $67,500 and $69,300 through Sunday and into Monday morning, with neither buyers nor sellers establishing control.
The current hourly candle at $68,543 sits within that same range. The 50-period simple moving average at $69,200 continues to slope downward above current price, acting as overhead resistance that has not been tested with any conviction since the breakdown. Price would need to reclaim and close above $69,200 to begin repairing the short-term structure.
What the RSI Shows
The 14-period RSI reads 49.82, with its signal line at 38.61. This is a meaningful improvement from the oversold reading of 27.20 recorded in the immediate aftermath of Saturday’s breakdown. The momentum indicator has recovered from its extreme low back toward the neutral 50 level, with the shorter-term reading crossing above the signal line, indicating that the selling intensity has diminished and buying has partially offset the weekend’s damage.
A reading near 50 reflects a market in balance rather than one with directional momentum in either direction. The recovery from 27 to nearly 50 over approximately 36 hours without a meaningful price recovery tells its own story. Selling pressure has exhausted itself from the weekend’s levels, but new buying conviction has not yet materialized to drive price higher.
The Broader Market Picture
The total crypto market cap sits at $2.35 trillion, down 0.73% on the day. The CMC20 index is at $141.45, down 0.35%. The Fear and Greed Index reads 26, in the Fear zone, having recovered slightly from the Extreme Fear reading of 10 recorded earlier this weekend but still reflecting a market operating from a defensive posture. The average crypto RSI across the market reads 37.91, flagged as oversold, consistent with the broad momentum compression covered in the weekly RSI heatmap reporting from earlier this week.
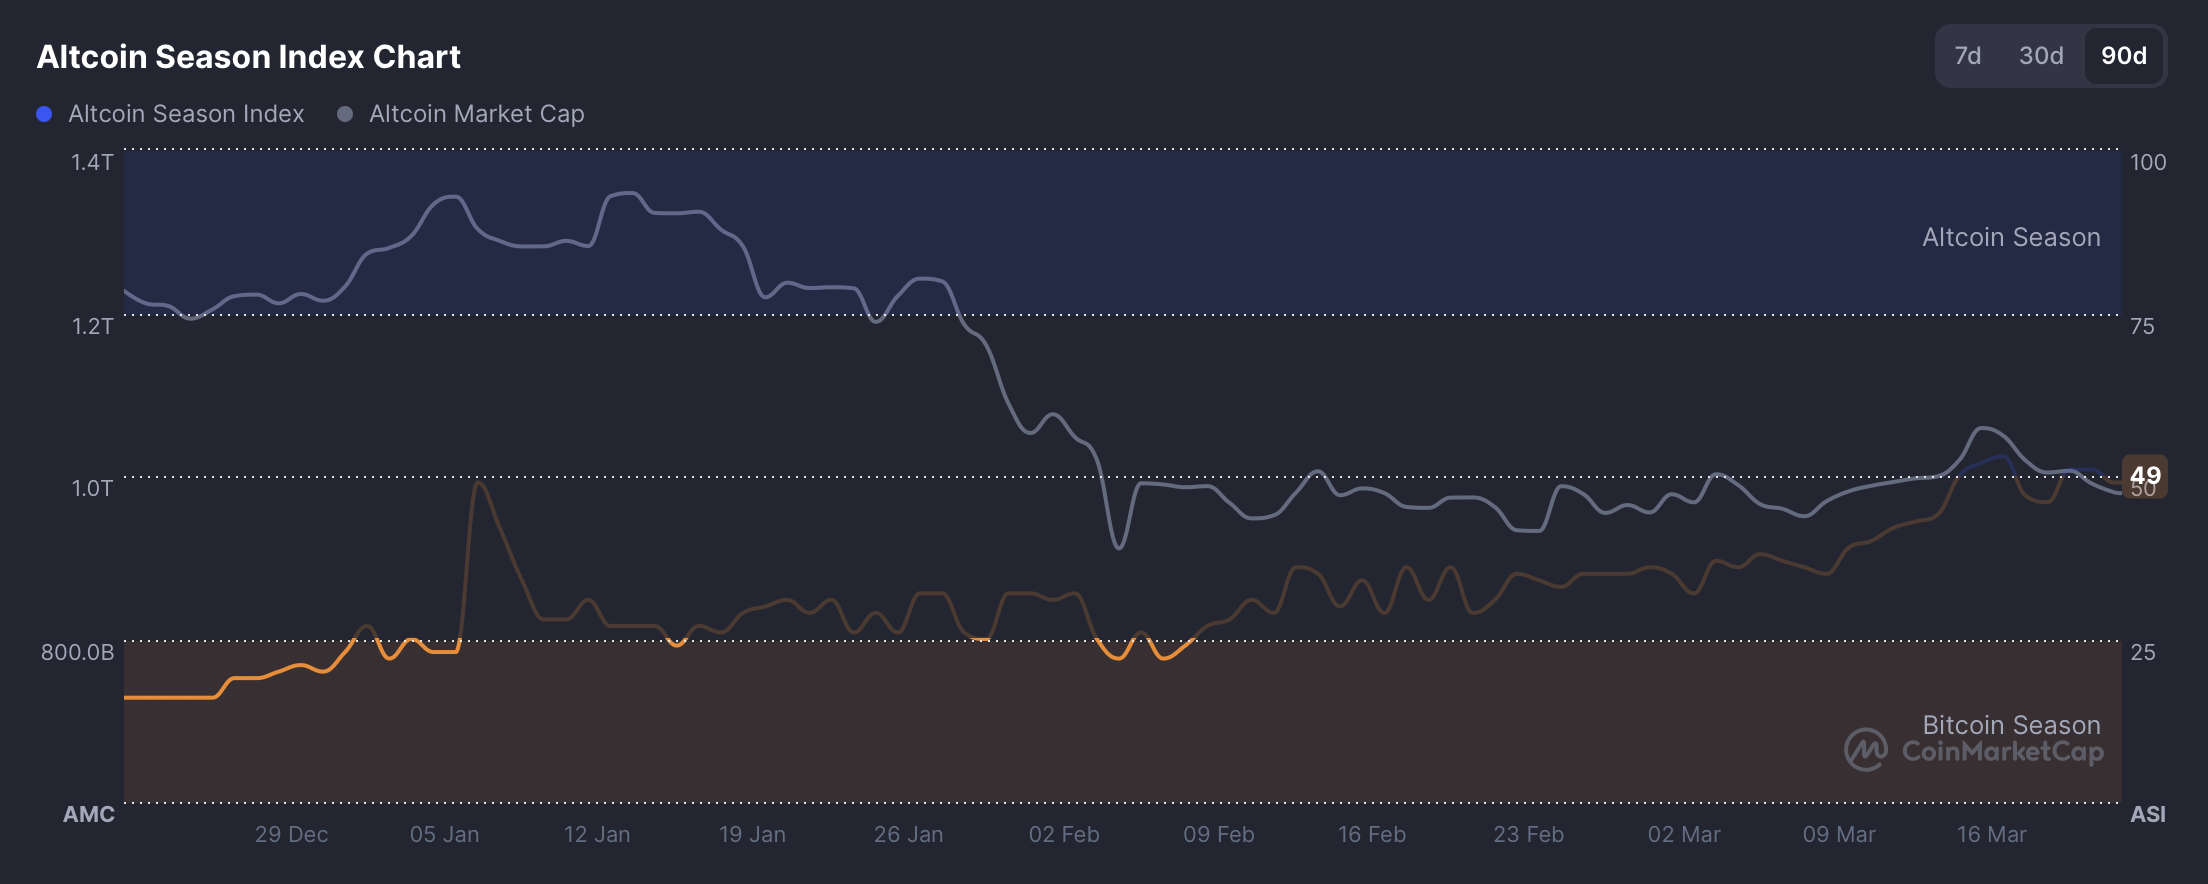
CoinMarketCap’s Altcoin Season index sits at 49 out of 100, directly on the midpoint between Bitcoin dominance and altcoin outperformance. That reading is essentially neutral and reflects the conditions visible in the price table, where most assets are moving in tandem with Bitcoin rather than diverging significantly in either direction.
Major Asset Prices
Bitcoin Cash is the notable outperformer in the top 11, down only 0.80% over seven days while most other major assets have lost between 6% and 11% on the weekly timeframe. Tron remains positive on the week at plus 3.77%, its second consecutive day as the only major non-stablecoin asset holding weekly gains. Ethereum is at $2,056, down 1.19% in 24 hours and 8.62% on the week. XRP is at $1.37, down 1.49% in 24 hours. Solana is at $86.31, down 0.91% in 24 hours and 7.48% over the week. Dogecoin remains the week’s worst performer at negative 10.55% over seven days. Hyperliquid at $37.64 continues its relative resilience with only a 2.93% weekly decline.
The hourly recoveries visible across most assets in the one-hour column, with Bitcoin up 0.96%, Ethereum up 1.02%, and Solana up 1.08%, reflect the exhaustion dynamic rather than a confirmed directional shift. The market has stopped falling at the pace it was falling. It has not yet decided where it goes next.


