


Bitcoin has pushed back into the $90,000 range, restoring momentum after weeks of indecision across the market. The recovery has revived the broader conversation around where the next meaningful resistance lies, and the latest analysis from Lark Davis outlines a clear technical roadmap.
His view aligns with Bitcoin’s historical tendency to regain strength quickly once it stabilizes above mid-cycle support. The first key hurdle now sits at the 50-week EMA near $100,000, a level that acts as both a technical ceiling and a psychological line. This threshold has repeatedly served as an inflection point during strong uptrends, and reclaiming it would signal a decisive shift in market sentiment.
The 50-Week EMA and Why $100K Matters
Bitcoin approaching the 50-week exponential moving average is more than just a chart milestone. Long-term EMAs reflect broader investor conviction, and when price reclaims them after extended declines, momentum often accelerates. With the moving average currently positioned around $100,000, the area becomes the first real test for bulls. It combines psychological weight with long-term market structure, setting the tone for whether Bitcoin can reestablish a dominant uptrend heading into 2026.
The Major Resistance Cluster at $108K-$110K
According to Davis, the real challenge lies slightly higher. The $108,000 to $110,000 zone forms a dense resistance cluster built from multiple technical confluences. It includes the 0.618 Fibonacci retracement, major horizontal resistance from previous cycle structure, and the Point of Control derived from the auto-anchored volume profile. When several indicators converge this tightly, the region tends to attract heavy liquidity and market reactions. This is the level Davis refers to as the “boss fight,” suggesting that breaking it would mark a structural shift in Bitcoin’s long-term trend.
Breaking Down the Chart
The chart highlights how cleanly these resistance levels align. The candle structure shows Bitcoin reclaiming higher lows after its recent pullback, while the 50-week EMA sits just overhead as the next barrier. Above it, the Fibonacci lines trace the retracement from previous highs, pinpointing the $108K–$110K zone with precision.
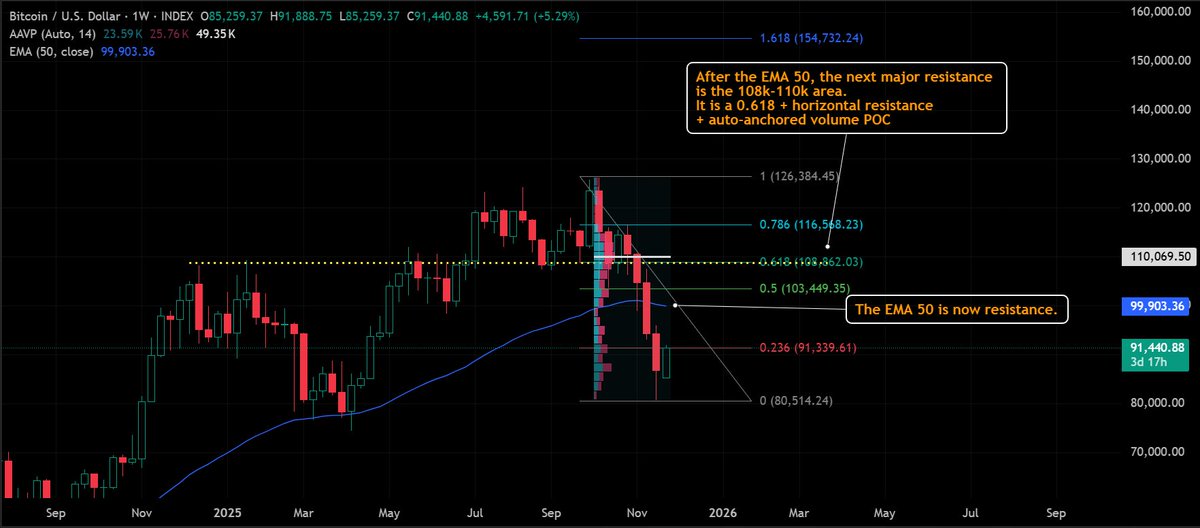
The Point of Control reinforces this area as the region where the most trading activity occurred in the prior cycle, making it a natural magnet for both sellers and profit-takers. The combination of retracement geometry, historical volume, and long-term moving averages paints a cohesive technical picture: $100K is the gateway, but $108K–$110K is the true battleground.
Why This Area Could Decide Bitcoin’s Next Move
Bitcoin’s ability to build sustained momentum typically depends on reclaiming high-timeframe levels where previous demand was strongest. If buyers can push through the first test at $100,000 and absorb supply in the $108K–$110K cluster, the market would be positioned for a more aggressive extension phase. Failing at either zone, however, would likely keep Bitcoin range-bound and vulnerable to renewed selling pressure. With volatility expected to rise into December, these levels have become the central focus for traders tracking the next directional move.
The Macro Backdrop Adds Fuel to the Setup
Broader macro positioning continues to influence Bitcoin’s trajectory. Traditional markets are navigating a mix of shifting Federal Reserve expectations, liquidity rotation, and persistent appetite for risk assets. Bitcoin’s resilience above $90,000 during this backdrop reflects strong underlying demand, particularly from long-term holders and institutional allocators. The next few weeks will reveal whether that demand is sufficient to carry the asset through the most significant technical cluster of the quarter.


