


Bitcoin’s momentum has deteriorated sharply over the past week, with the price sliding to $95,000 and several key indicators aligning to confirm mounting bearish pressure. Fresh data from 10x Research and TradingView charts show that whale selling, weakening institutional demand, and critical moving-average breakdowns are now converging into Bitcoin’s worst weekly performance in months.
Whale Selling and ETF Outflows Hit at the Same Time
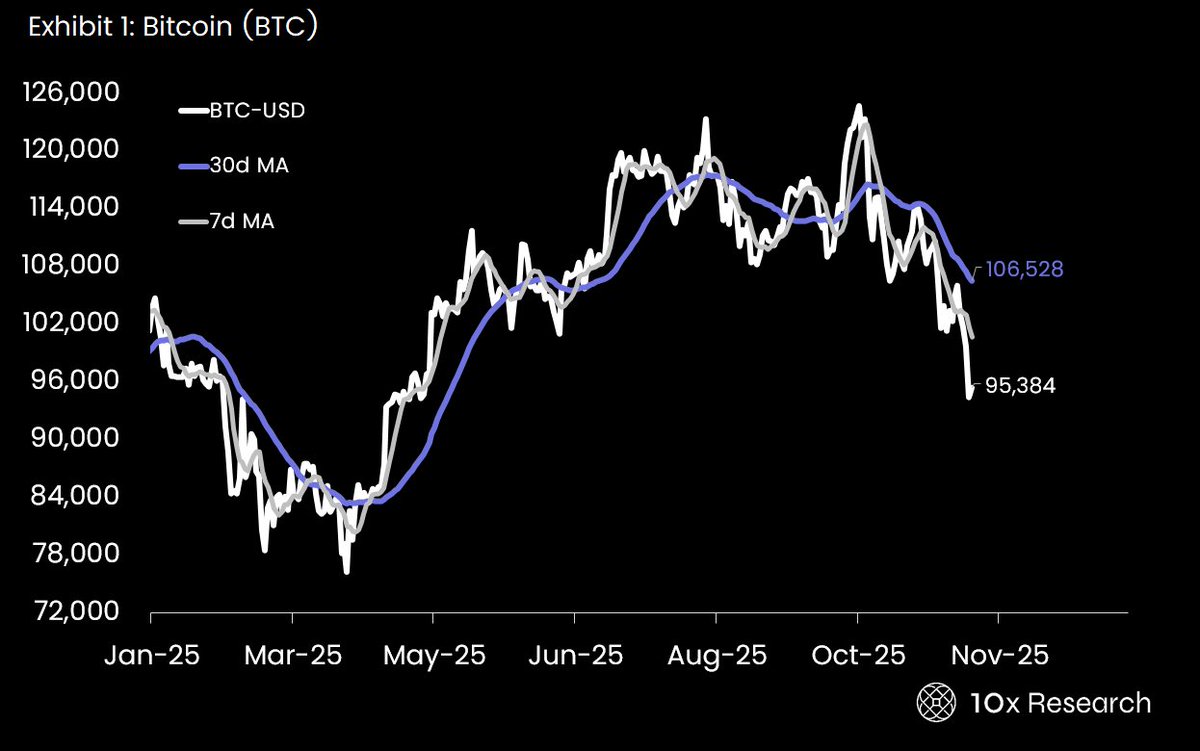
According to 10x Research, Bitcoin has fallen below both the 7-day and 30-day moving averages, a technical combination that historically precedes deeper corrections. The selloff intensified as large holders, “whales”, offloaded significant amounts of BTC, pushing weekly performance down -6.7% and dragging the price under the $100,000 psychological threshold.
Compounding the issue, U.S. spot Bitcoin ETFs saw a sharp rise in outflows, signalling weakening institutional appetite. After months of steady inflows, the sudden reversal underscores how sensitive funds have become to market uncertainty.
Macro Correlation Adds More Downside Risk
Bitcoin’s correlation structure has also turned less favourable. 10x Research notes a negative skew with the Nasdaq 100, meaning Bitcoin is reacting more strongly to tech-sector sell-offs than it benefits from tech-sector rallies. This asymmetry has amplified volatility, especially as global equities face renewed pressure.
Even with central-bank rate-cut expectations and ETF optimism still in play, these macro catalysts are failing to create upside momentum. Instead, Bitcoin is moving more defensively, mirroring risk-off dynamics across traditional markets.
Technical Indicators Point to Continued Caution
TradingView charts reinforce this weakening trend:
Price Action:
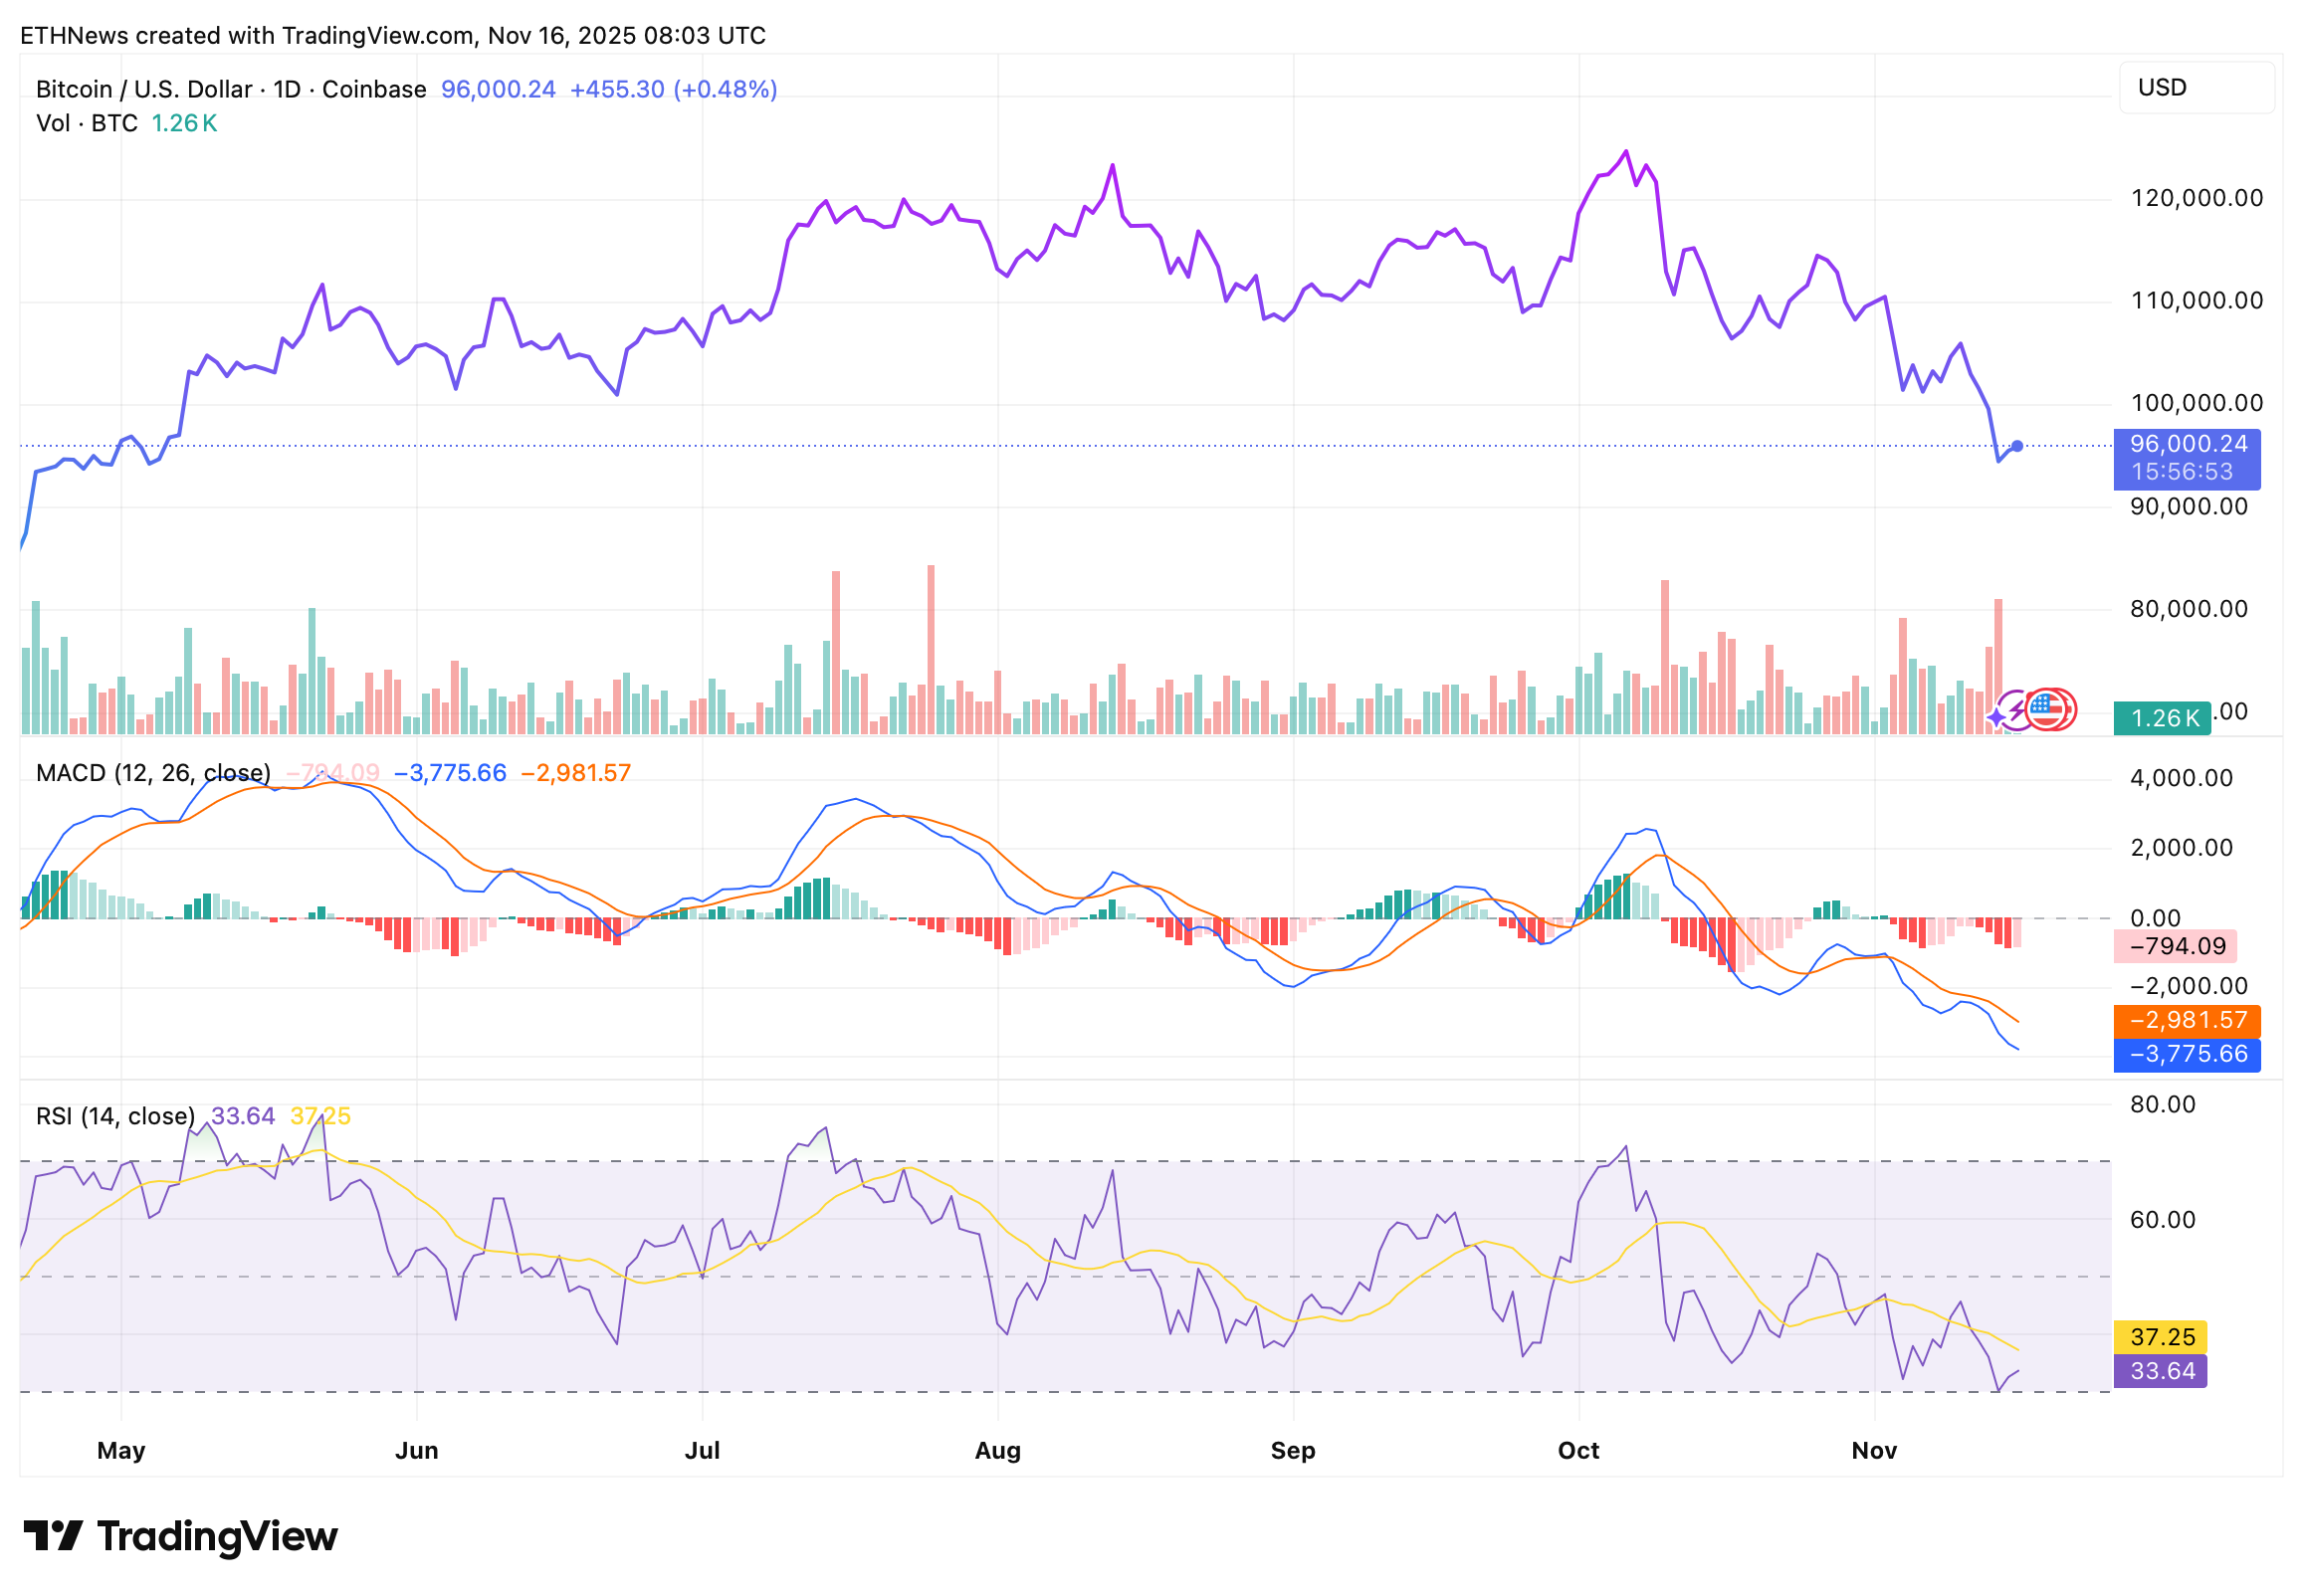
• BTC has broken decisively below $100,000 and is struggling to find stable footing near $95,000.
• The latest bounce attempts show limited follow-through, reflecting buyer hesitation.
MACD:
• The MACD line has fallen sharply to -3,775, widening its distance from the signal line.
• Momentum remains deeply negative with no convergence yet to suggest reversal.
RSI:
• The RSI sits near 33, hovering just above oversold territory.
• While this suggests conditions are stretched, it does not yet confirm a bottom, similar RSI readings earlier this year preceded multi-week downtrends.
Volume:
• Volume remains muted outside of sell-heavy spikes, indicating buyers are not stepping in with conviction.
Short-Term Outlook: Buyers Must Defend the Mid-$90K Zone
Bitcoin’s near-term trajectory depends on whether bulls can stabilize price above the $94K–$96K support band. Losing this region could expose a deeper retracement toward the $90,000–$92,000 zone, where stronger historical liquidity sits.
To regain momentum, Bitcoin would need:
• A real reclaim of the 30-day MA (~$106,000),
• Renewed ETF inflows, and
• A shift in whale behavior from net selling to accumulation.
For now, the market structure remains decisively bearish. As liquidity thins and macro headwinds persist, traders are preparing for continued volatility while watching closely for signs of stabilization in the critical mid-$90K region.


