


Bitcoin has fallen to the $70,000 level for the first time in roughly 15 months, confirming a deep corrective phase after the 2025 peak.
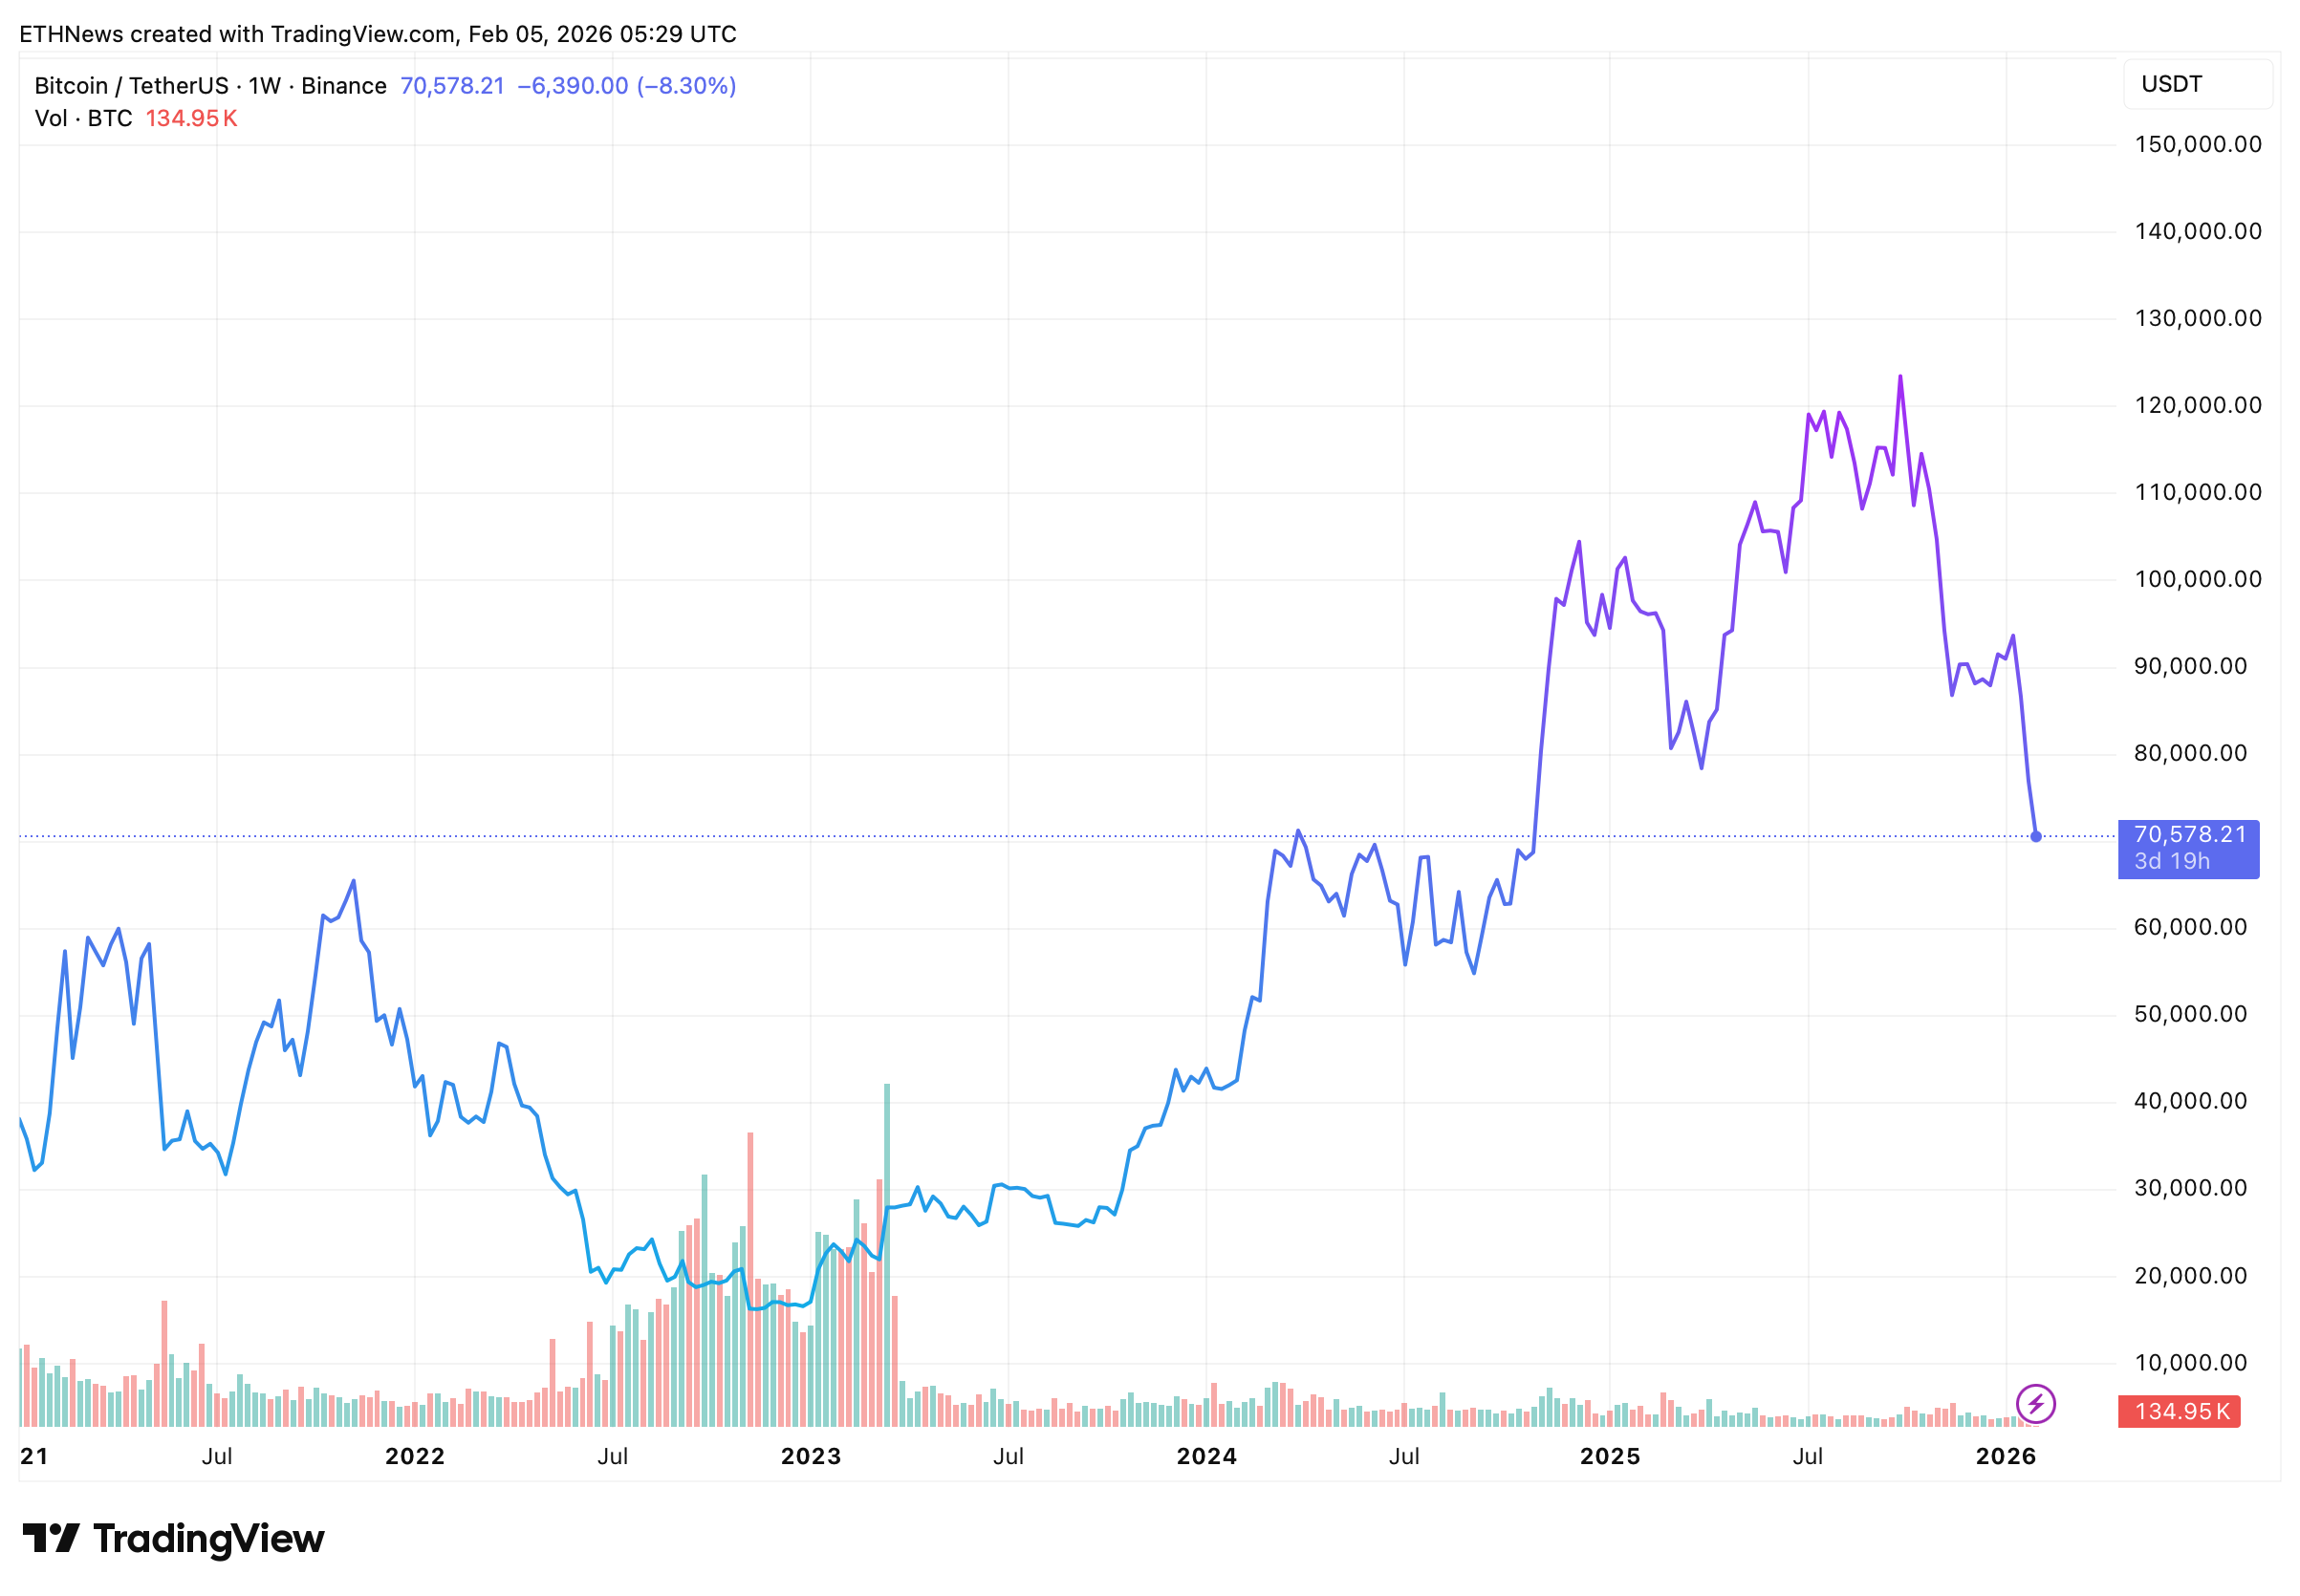
The TradingView chart shows BTC trading near $70,215, following a sustained breakdown from the cycle high.
From peak to trough, Bitcoin has declined by more than 40%, marking one of the sharpest multi-week drawdowns since the prior market cycle.
Sharp Breakdown From 2025 Highs
The chart illustrates a clear transition from strong upside momentum into a steep reversal. After topping, Bitcoin failed to hold higher support zones and entered a sequence of lower highs and lower lows.
The acceleration lower becomes especially visible in late 2025 and early 2026, where price moved rapidly from the $90,000–$95,000 range down toward $70,000.
This decline has erased nearly all gains made during the second half of 2025, placing Bitcoin back into price territory last seen in late 2024.
Trend Structure Turns Decisively Bearish
Multiple indicators shown alongside price reinforce the bearish structure:
- Bitcoin is trading well below its 50-day moving average ($88,797)
- Price is also far below the 200-day moving average ($103,326)
- The 14-day RSI at 24 places Bitcoin firmly in oversold territory
These readings indicate that downside momentum has dominated recent sessions, with sellers in control across multiple timeframes.
Fear and Volatility Spike as Selling Accelerates
Market sentiment visible in the snapshot has shifted decisively negative. The Fear & Greed Index at 14 (Extreme Fear)reflects widespread risk aversion, while volatility remains elevated. Over the past seven days alone, Bitcoin is down more than 20%, reinforcing that the move toward $70,000 has been fast and emotionally driven.
Only 10 of the last 30 days have closed green, underscoring how persistent selling pressure has been during this decline.
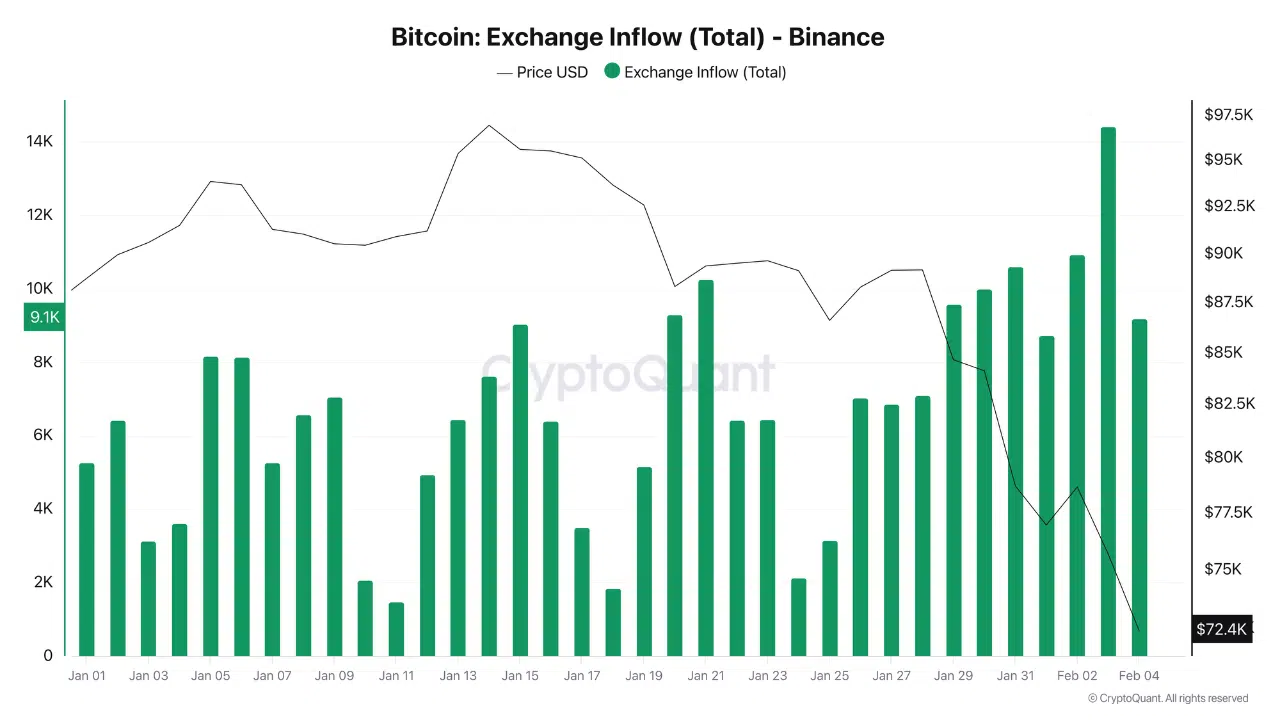
Exchange and Flow Pressure Reinforce the Move
Data referenced from CryptoQuant aligns with what the chart reflects visually. Heavy exchange inflows, particularly into Binance, emerged as Bitcoin approached the $74,000–$72,000 area. Such inflows typically coincide with increased sell-side activity, adding fuel to downside moves during periods of panic or forced de-risking.
What the $70,000 Level Represents
The $70,000 zone now stands as a critical psychological and technical level. It marks:
- A 35% drawdown from the 2025 peak
- The lowest weekly price in over a year
- A point where Bitcoin is deeply stretched below long-term trend averages
Historically, similar conditions have often preceded periods of consolidation or stabilization. However, based strictly on the chart, the market remains in a phase of testing demand, not signaling a confirmed reversal yet.


