


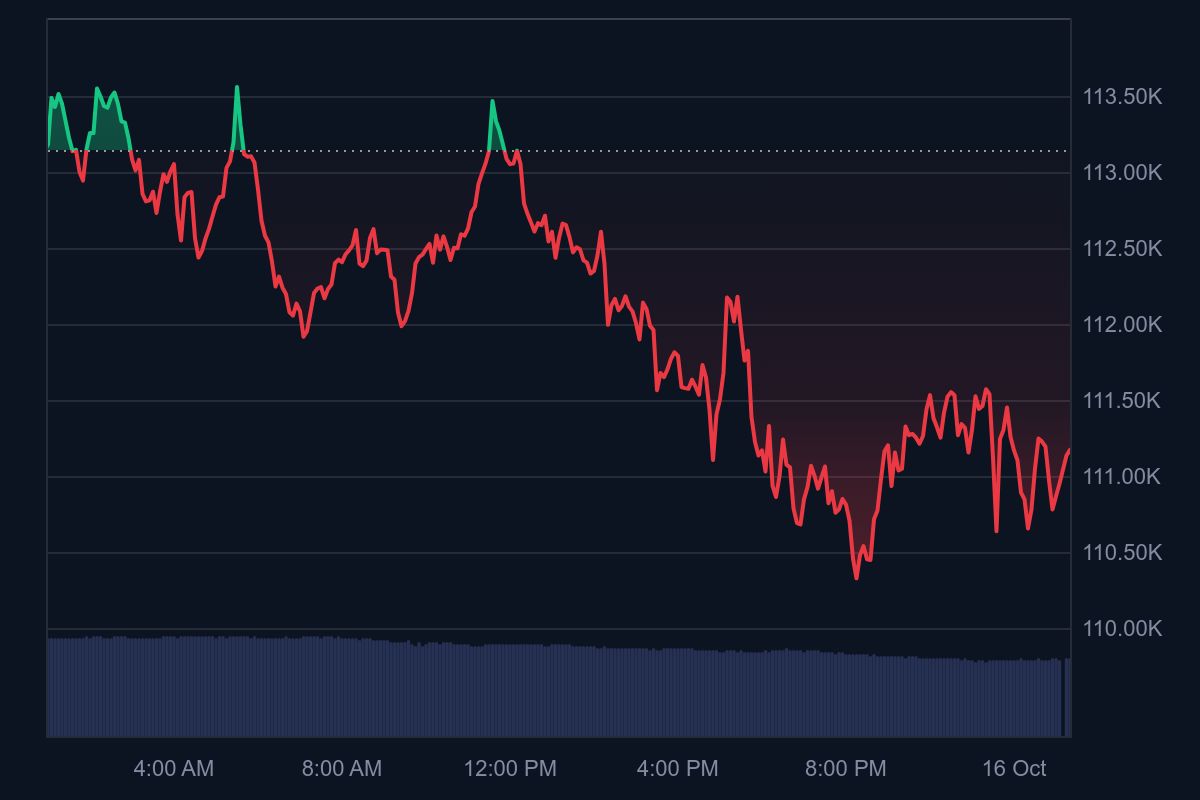
Bitcoin (BTC) extended its correction to $111,100, down 11.8% from its recent all-time high of $125,800 nine days ago, according to data from CoinMarketCap.
The sharp drawdown follows heavy short-term holder (STH) capitulation, with over 56,000 BTC moved to exchanges between October 13–15, signaling widespread profit-taking at a loss.
Santiment: Market in “Overreaction” Range
According to Santiment, Bitcoin’s pullback appears to be an “overreaction” phase following President Donald Trump’s recent temporary tariff threats, which jolted risk assets. The data shows that while Bitcoin and equities declined, gold surged +6% since October 6, reflecting a rotation toward safe-haven assets.
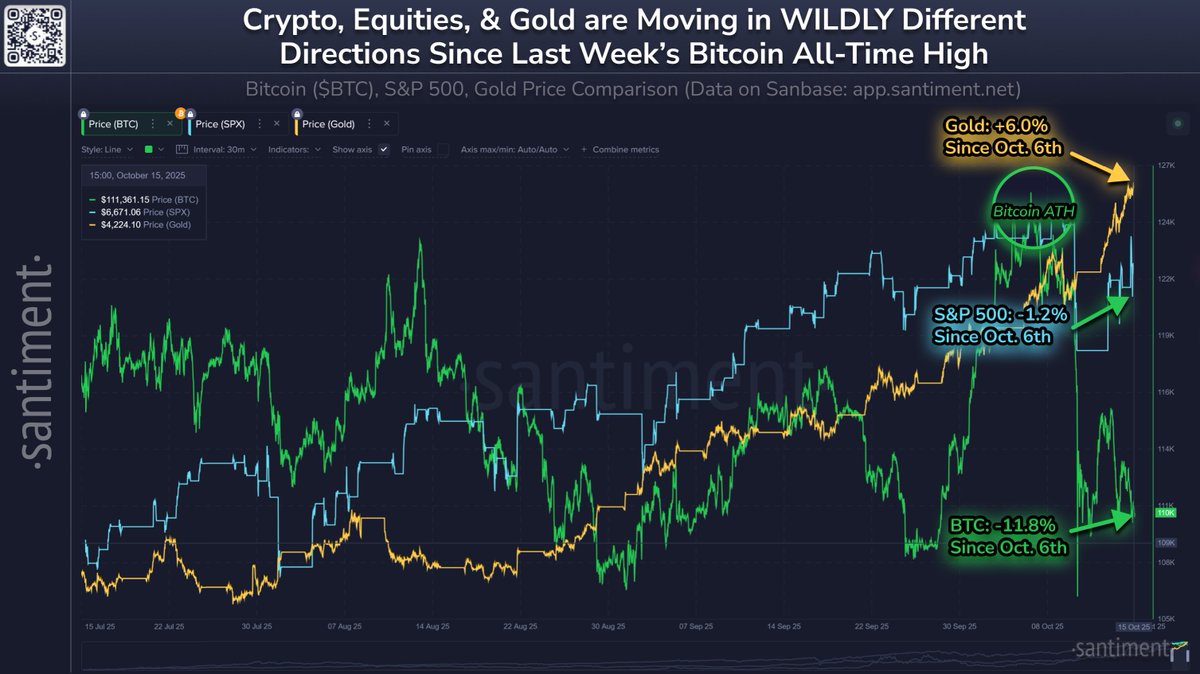
The correlation chart from Santiment highlights diverging trends:
- BTC: -11.8% since October 6
- S&P 500: -1.2%
- Gold: +6.0%
Technical Breakdown
BTC recently broke below both the 30-day SMA ($116,203) and the 200-day EMA ($108,101), confirming short-term weakness. The RSI-14 sits at 44.04, indicating neutral momentum, while the MACD histogram (-918) shows accelerating bearish momentum.
The STH Spent Output Profit Ratio (SOPR) also dipped below 1.0, a clear sign that traders are realizing losses. Historically, sustained SOPR readings under 0.975 have preceded steeper sell-offs, as fear-driven exits create a self-reinforcing feedback loop.
Key Levels to Watch
- Immediate resistance: $115,390 (50% Fibonacci retracement)
- Major support: $109,208 (78.6% Fib level)
- Psychological zone: $108,100 (200-day EMA)
- A daily close above $119,000 (23.6% Fib) would invalidate the bearish structure and could trigger a rebound toward $125K. Until then, traders are closely monitoring whether the $109K–$108K support cluster can absorb further selling pressure.


