


Bitcoin staged a sharp intraday surge, briefly pushing above the $93,000 level before easing back, according to the latest price and market data.
The move capped a strong multi-day advance that began below $88,000 and accelerated into early January, highlighting renewed short-term momentum despite fragile broader sentiment.
A Clean Intraday Breakout, Followed by Consolidation
The price chart shows Bitcoin trending steadily higher through January 2–4, with higher highs and higher lows forming a clear short-term uptrend. Momentum intensified during the latest session as price rapidly expanded upward, slicing through prior resistance zones and briefly topping out just above $93,000.
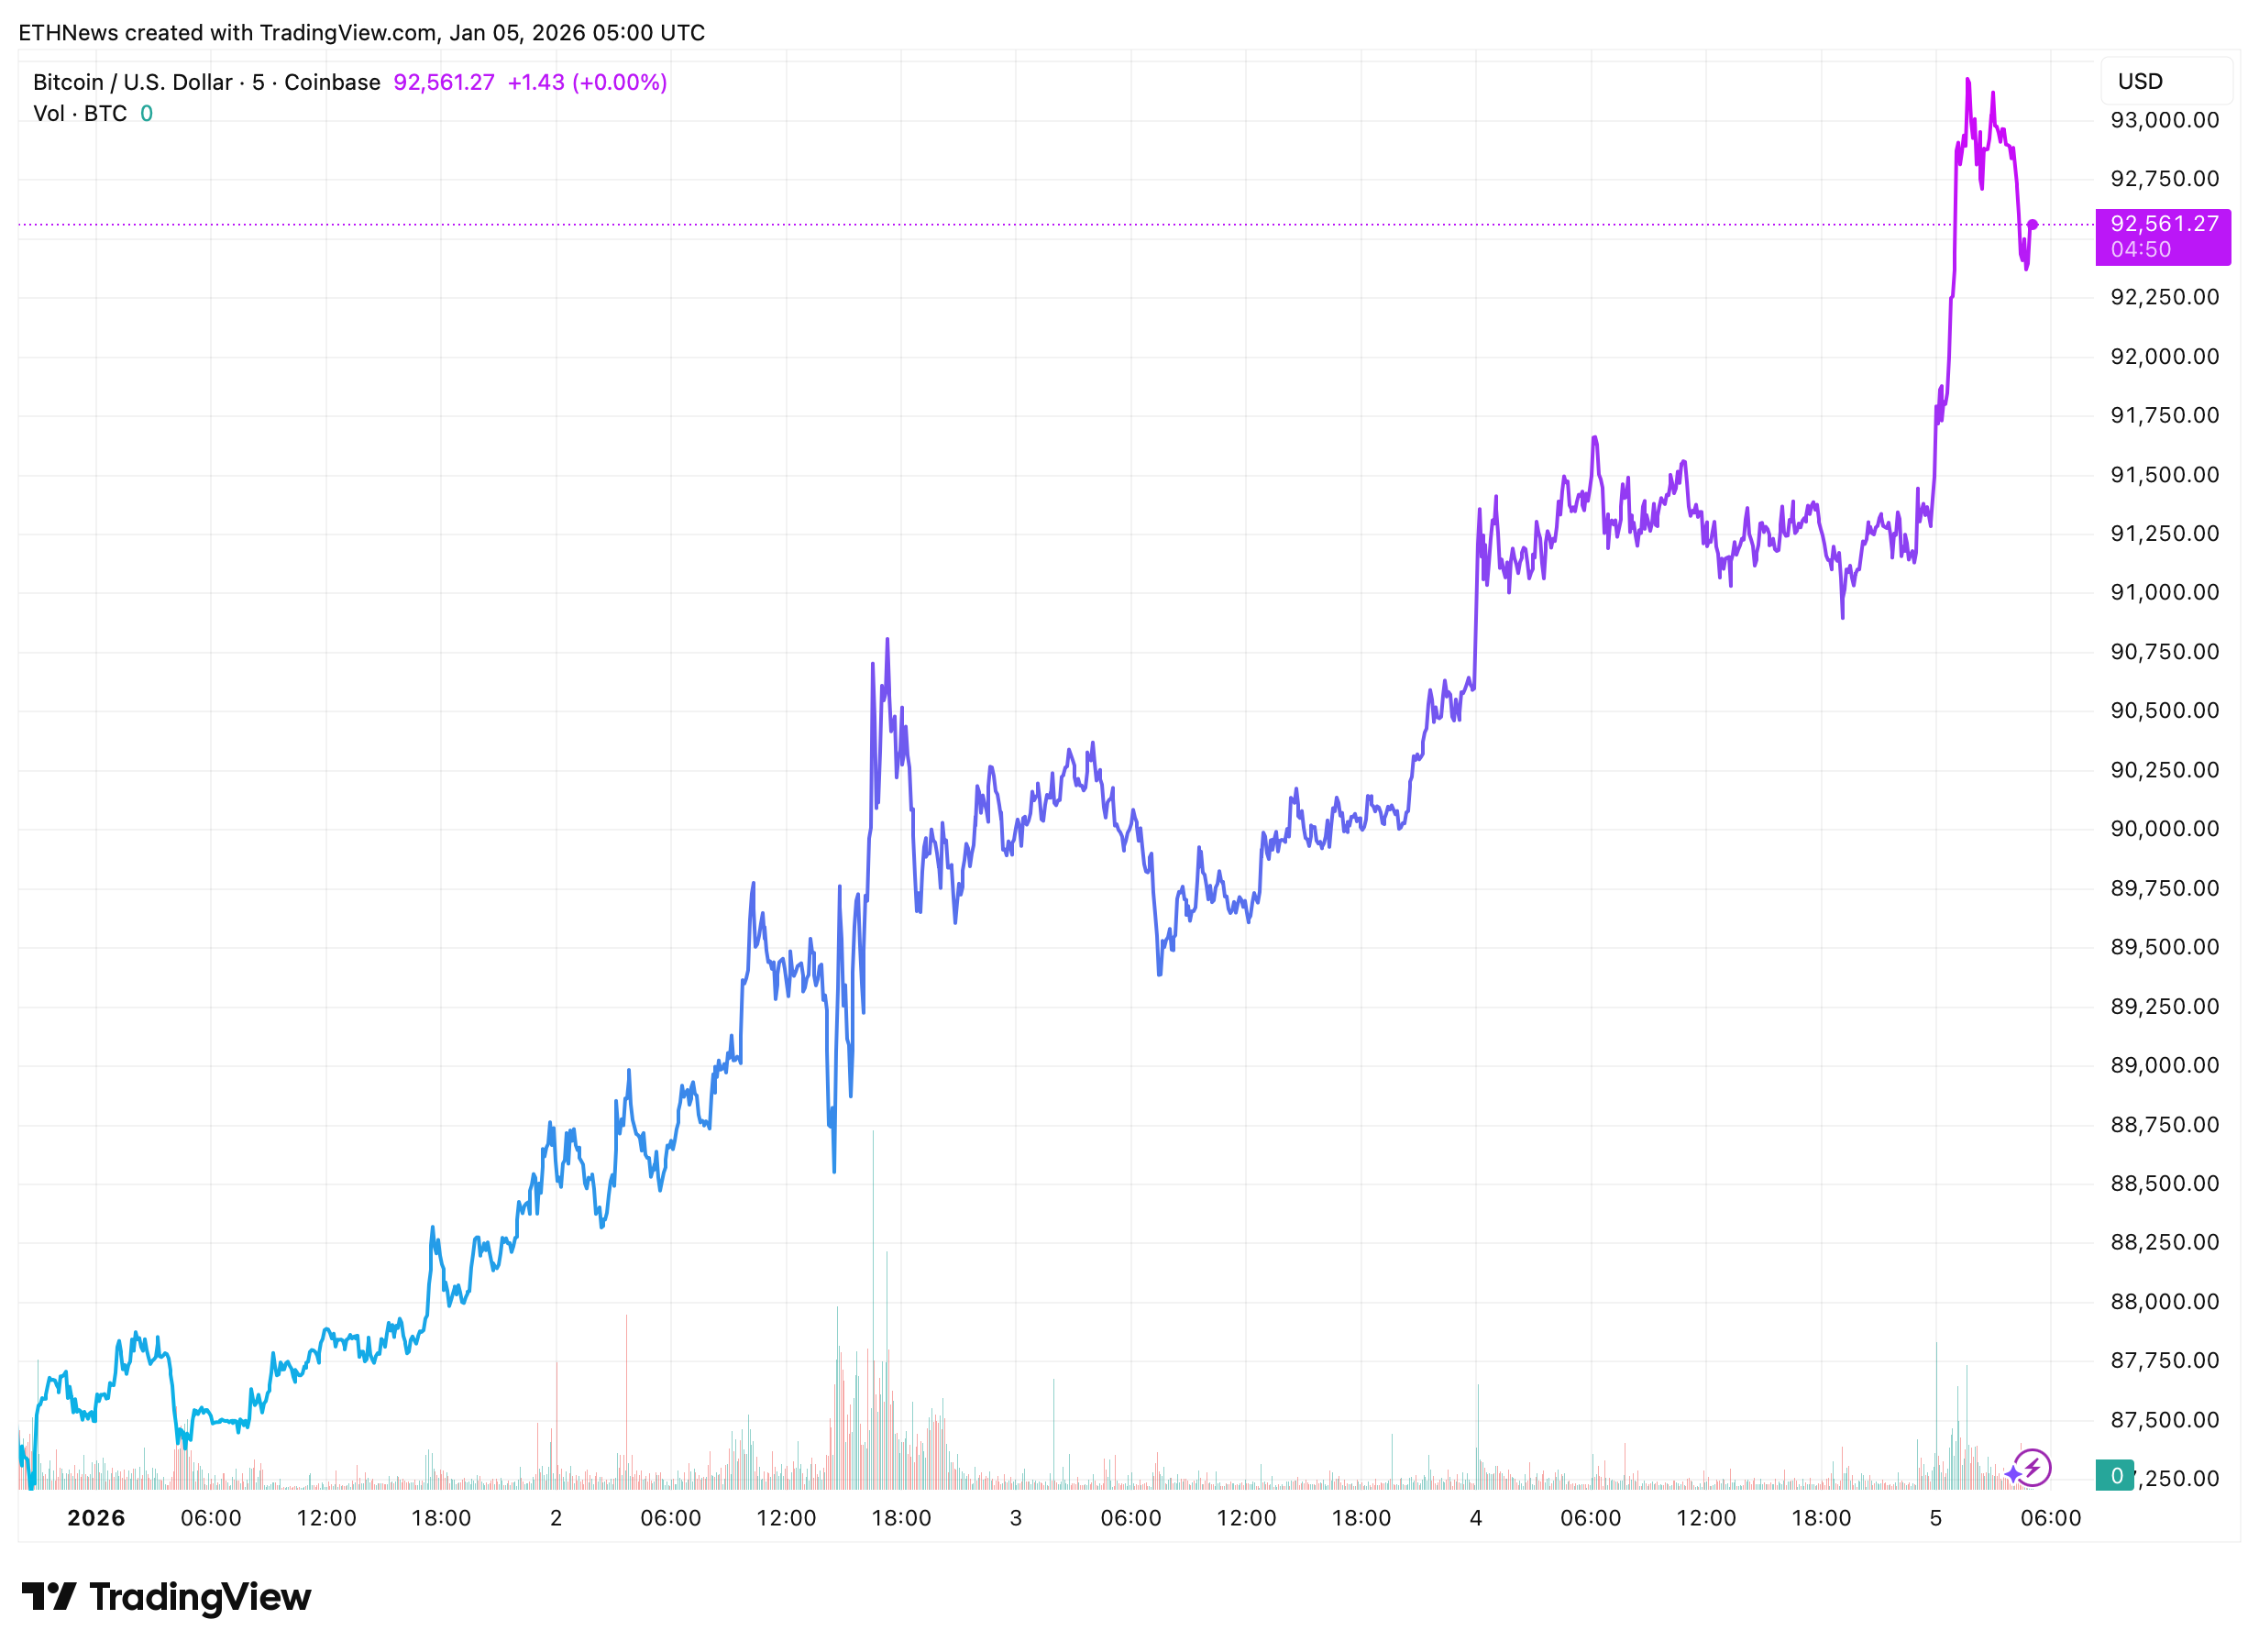
After the spike, price retraced modestly and stabilized around the $92,500–$92,600 area. This behavior suggests profit-taking rather than panic selling, with the pullback occurring after a near-vertical move. Volume also increased during the breakout phase, reinforcing that the push higher was supported by active participation rather than thin liquidity.
Short-Term Structure Remains Constructive
Despite the rejection near $93,000, the broader structure on the chart remains constructive. Price continues to hold well above the $90,000 region, which now acts as a key short-term support zone. As long as Bitcoin remains above this level, the recent breakout attempt keeps bullish pressure intact, even if further consolidation is needed before another test higher.
Volatility remains relatively low compared to historical breakout phases, indicating that the move has not yet triggered widespread instability. This calmer volatility profile often aligns with controlled advances rather than blow-off tops.
Market Metrics Paint a Mixed Picture
Supplementary data provides additional context. Bitcoin is currently trading around $92,600, with short-term indicators leaning neutral rather than overheated. The 14-day RSI sits in the mid-50s, signaling balanced momentum rather than extreme conditions.
This divergence suggests that while price action has improved, broader market confidence has not fully caught up. Historically, such conditions can support continuation moves if skepticism gradually unwinds, but they also leave room for sharp reactions if momentum stalls.
What the $93,000 Test Signals
The brief move above $93,000 marks an important psychological and technical moment. It confirms that buyers are willing to challenge higher levels, even as longer-term resistance, such as the 200-day moving average shown in the data panel, still looms above current price.
In the near term, Bitcoin’s ability to hold above the low-$92,000 range will be critical. Sustained consolidation here would keep the breakout narrative alive, while a deeper pullback toward $90,000 would test whether recent gains are being defended or reassessed.
For now, the chart tells a clear story: Bitcoin made a decisive push, tested a major level, and paused, not collapsed. How price behaves after this pause will determine whether the $93,000 mark becomes a ceiling or a stepping stone.


