


- ETH’s price declined nearly 6% as traders reduced risk exposure ahead of this week’s Federal Reserve interest rate decision.
- A bull pennant pattern projects potential ETH gains up to $6,750 by October, reflecting over 45% upside.
The price of ETH has decreased by 5.73% from its recent high. This drop occurred as traders reduced their exposure to risk ahead of a Federal Reserve meeting. The market is now focused on whether a change in Fed policy could influence ETH’s next price movement.
ETH is currently finding support near a key technical level, the 20-day exponential moving average, which is around $4,450. This price action happens as market data shows a high probability of an interest rate cut from the Fed. Expectations also include two additional cuts before the end of the year.
The recent price activity has formed a specific pattern on the chart known as a bull pennant. Trading volume has decreased during this period, which is typical for this formation. A completed breakout from this pattern suggests a potential price target of $6,750 by October. This would represent an increase of over 45% from current values.
If the price fails to hold above the $4,450 level, a further decline toward the $4,200 to $4,350 area is possible. However, ETHNews analysts view any such price drop as a buying opportunity. They argue that investor demand would likely prevent a deep correction and instead push the price upward.
$ETH can pull something like this pic.twitter.com/x68zrgJDZt
— Ash Crypto (@Ashcryptoreal) September 15, 2025
One chartist noted that a move below the pennant’s lower boundary would not cancel the positive outlook. Instead, it could set the stage for a push above $5,000. This is described as a common “breakout and retest” sequence, where a price pulls back to a former resistance level to confirm it as new support before advancing.
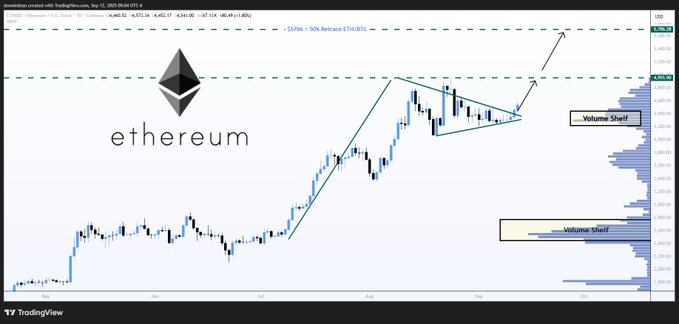
$ETH $ETHUSD Ethereum – Breakout
Price Targets: $5766, $6658, $9547
ETH is starting a breakout of the descending wedge and on its way to challenge previous highs at $4955.
The next target is $5766 at a 50% retracement of the ETH/BTC ratio. Then is $6658 at the 618 fib level… pic.twitter.com/I6m0m5ZZ0X
— Donald Dean (@donaldjdean) September 3, 2025
The analyst stated that as long as the price remains above a specific Fibonacci retracement zone, further gains are the more probable outcome. Another chartist suggested Ethereum might still retreat to a support band between $4,100 and $4,300 before initiating a stronger upward move.
Ethereum (ETH) is trading at $4,477.70, down 1.04% on the day but continuing to show strength over the medium-to-long term. ETH has surged 117.66% in the last 6 months and is up nearly 94% over the past year, with year-to-date gains standing at 34.5%. Despite the intraday red candle, Ethereum remains technically bullish and sits within reach of its all-time high of $4,955.30.
Market sentiment is largely being shaped by macroeconomic expectations and ETF developments. Tom Lee of Fundstrat has made headlines, predicting ETH could reach $5,500 by mid-October, driven by expectations of a Federal Reserve interest rate cut.
This aligns with a growing narrative that Ethereum stands to benefit significantly from a risk-on environment. Meanwhile, Bitmine analysts have issued a short-term caution, identifying potential dips to $4,418 or even $4,375 this week as part of natural market rebalancing.
On the technical side, Ethereum has recently broken out above a descending trendline and cleared key resistance levels around $4,365–$4,380. However, RSI readings are beginning to flatten, suggesting short-term consolidation.
Traders are split between bullish targets at $5,000–$5,500, and bearish scenarios calling for a pullback to $4,200–$4,300 for liquidity sweeps before the next leg up.


