


CryptoQuant data shows aggregated altcoin trading volume for stablecoin pairs, excluding ETH, XRP, BNB, and SOL, has been running at levels that dwarf the entire 2019 to 2022 period, with strong buy walls present throughout the current cycle’s accumulation phase.
What the Chart Shows
The CryptoQuant chart covers 2018 through early 2026 and tracks two things simultaneously: total CEX volume for altcoin-stablecoin pairs in the left axis (billions), and the ETH price in the right axis as a market cycle reference.
From 2018 through mid-2021, the blue volume bars are barely visible. The entire 2019 accumulation phase that preceded the 2021 bull run, highlighted in the smaller red box on the chart, shows volume that barely registers on the scale of what came later. The bars are small, infrequent, and mostly without the green strong-buy-wall signal.
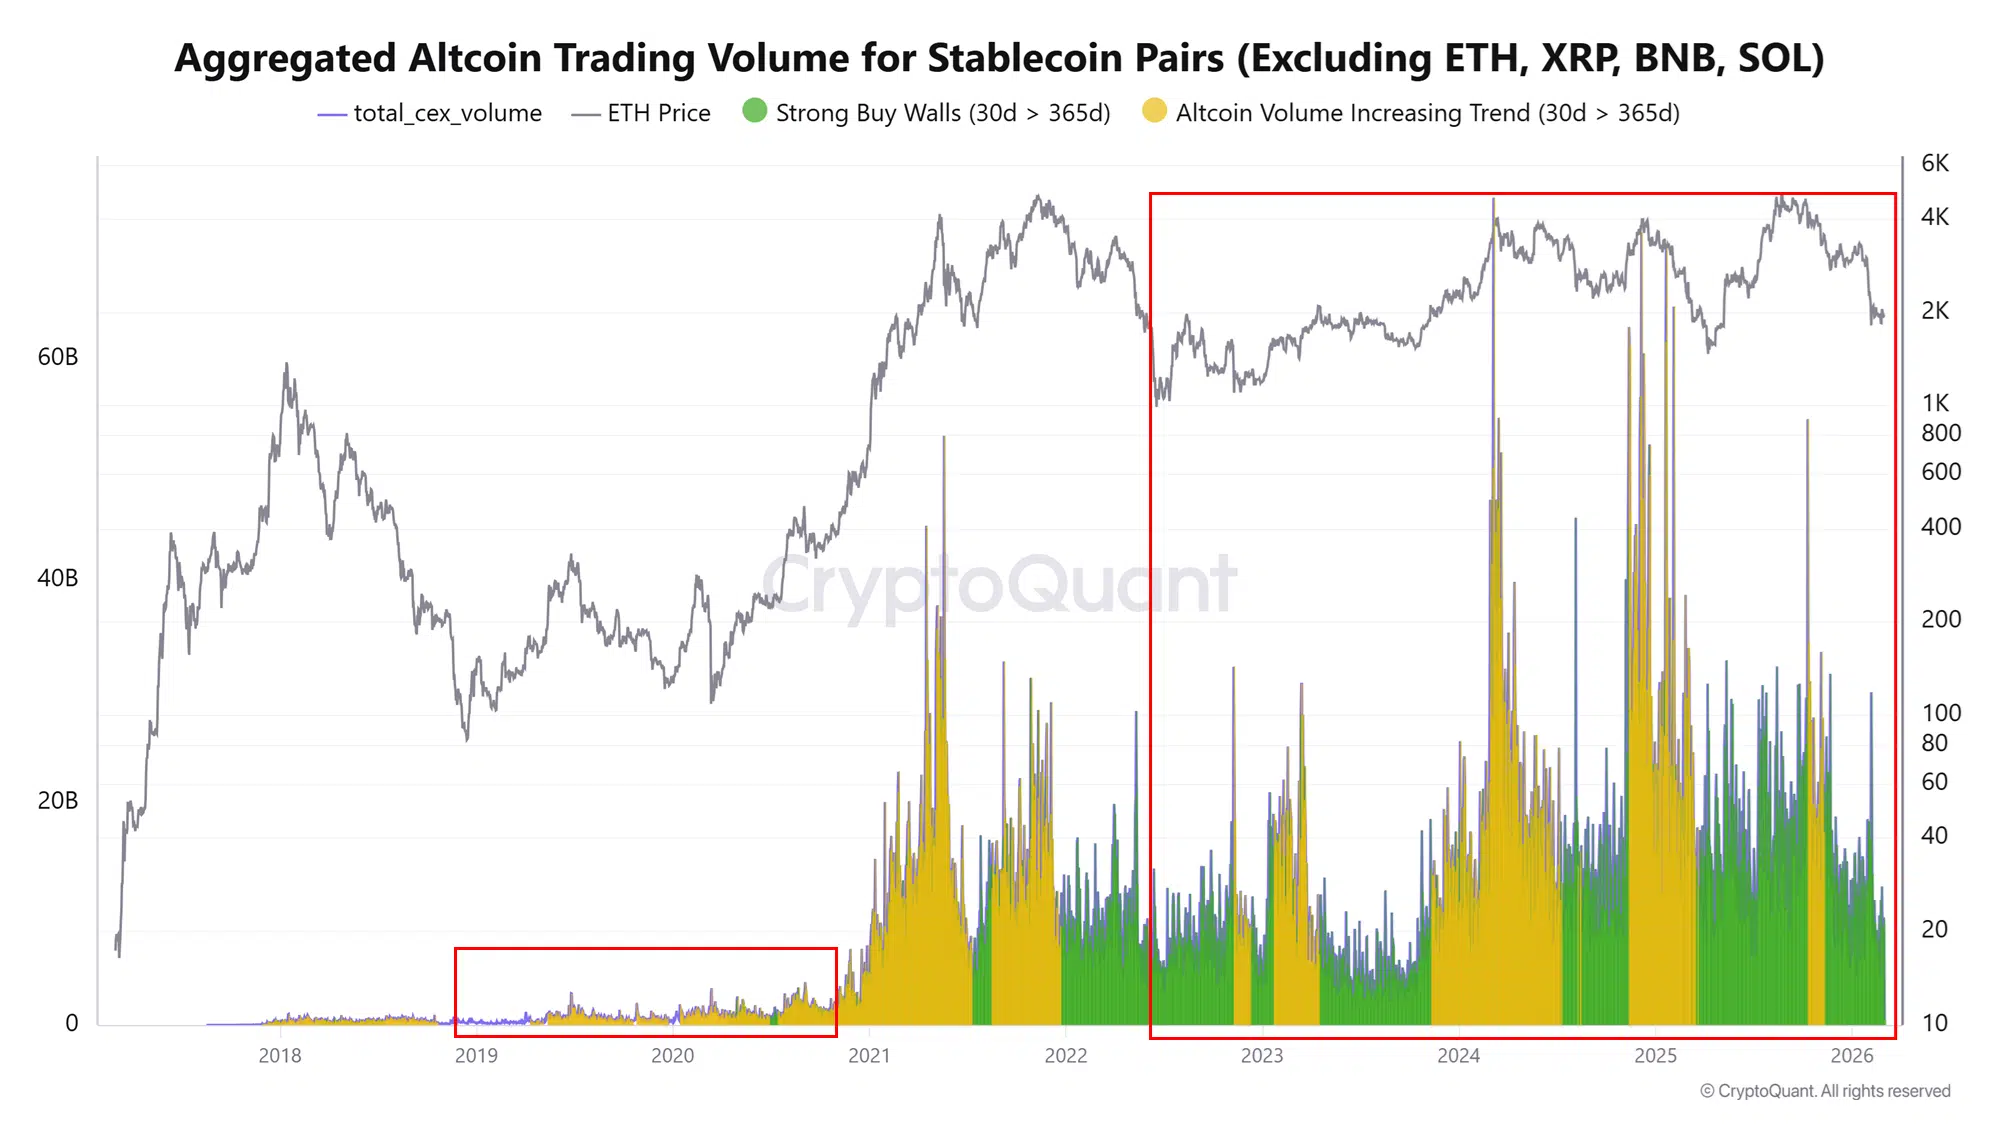
Then 2021 happened. Volume spiked dramatically. And since the 2022 bear market bottom, the chart shows something different from every prior cycle: the volume baseline never returned to pre-2021 levels. The large red box on the right side of the chart, covering 2023 through early 2026, shows volume bars that are consistently larger than anything visible in the 2019 to 2020 accumulation phase. Green strong-buy-wall bars are present throughout. Yellow altcoin-volume-increasing-trend bars appear frequently.
The analyst’s observation is that current accumulation phase volume is unparalleled relative to the 2019 equivalent. The chart supports that reading. The bars in the 2023 to 2026 period are not just larger than 2019 accumulation. They are dramatically, structurally larger.
What Strong Buy Walls Mean
The green bars on the chart represent periods where 30-day altcoin trading volume exceeds 365-day altcoin trading volume. That is the buy wall signal. When short-term volume is running above the long-term average, it means buying pressure has accelerated beyond the baseline trend. It is a measurement of demand intensity, not just volume level.
The green buy wall bars are largely absent from the 2019 to 2020 accumulation period. They appear sporadically through 2021 and 2022. In the current cycle from 2023 onward, they are a persistent feature of the chart. There are very few recent bars that are not at least partially green.
That persistence is the point of the analysis. In prior cycles, strong buy walls were event-driven spikes that appeared during specific rally phases. In the current cycle, they have been a background condition throughout the accumulation period.
The Excluded Assets Matter
The chart excludes ETH, XRP, BNB, and SOL. That exclusion is methodologically important. Those four assets alone represent a significant fraction of total altcoin volume and each has specific narratives driving their individual trading. Including them would obscure the signal from the broader long-tail altcoin universe.
The volume being measured here is the hundreds or thousands of smaller altcoins that do not have the ETF products, institutional backing, or ecosystem-specific narratives of the major four. That this category of altcoins is showing unprecedented accumulation-phase volume and persistent buy walls is a different signal than large-cap altcoin strength.
The 38.8% of altcoins near all-time lows covered earlier this week sits alongside this data as an apparent contradiction. Both can be true simultaneously. A large number of altcoins near ATLs while stablecoin-pair trading volume for the altcoin universe is at record accumulation levels describes a market where significant capital is actively rotating into altcoin positions at depressed prices, not one where the category is being abandoned.
The Caveat
Volume during accumulation precedes alt seasons historically. It does not guarantee them. The 2022 bear market showed that sustained accumulation volume can exist alongside continued price decline if macro conditions are adverse enough.
The current environment has Bitcoin at five-month lows, geopolitical tensions at their highest level of the year, and retail crypto sentiment at multi-year lows. Those conditions are headwinds. The accumulation volume data suggests patient capital is positioning through them. Whether that positioning is correct depends on catalysts, the Fed, the CLARITY Act, the geopolitical resolution, that are not visible in the volume data itself.


