


Bitcoin is trading near a critical inflection zone, according to the latest Bitcoin Exchange Liquidation Map, which highlights a dense concentration of leveraged short positions sitting just above the current price.
With BTC hovering around $88,100, the chart reveals that a relatively modest upside move could trigger cascading liquidations across major derivatives venues.
The data suggests that market structure is increasingly asymmetric, with short-side risk significantly outweighing long-side exposure in the near term.
Liquidation Map Shows Heavy Short Exposure Above Price
The liquidation map aggregates leveraged positioning across major exchanges, including Binance, OKX, and Bybit, and plots where forced liquidations would occur if price moves into specific zones.
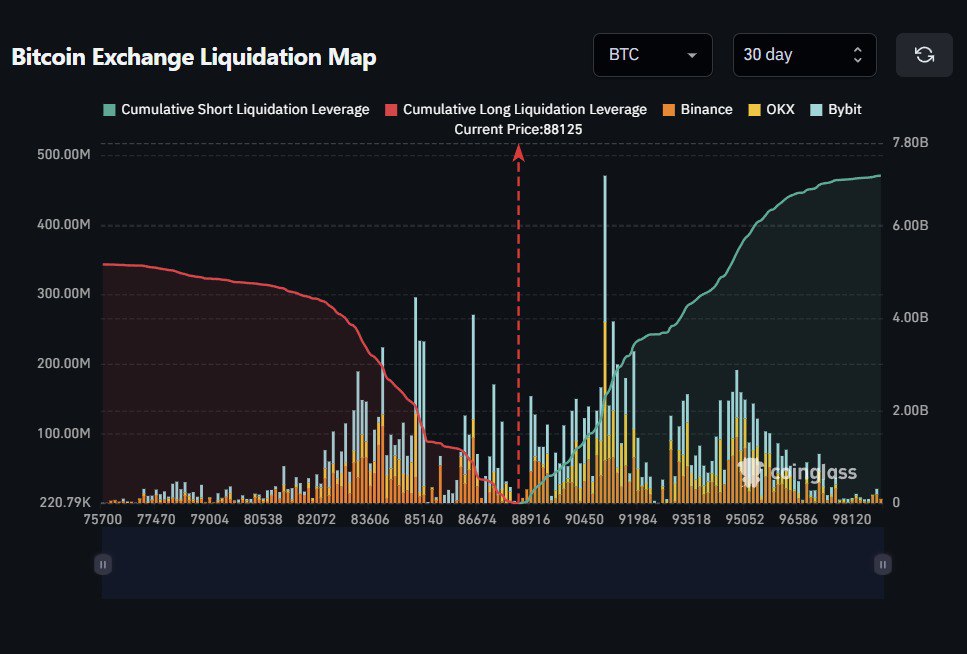
At current levels, cumulative short liquidation leverage rises sharply above $88K, forming a steep curve that accelerates toward the $95K–$98K range. According to the chart, more than $7 billion in short positions would be at risk if Bitcoin were to rally by roughly $10,000 from current prices.
This creates a clear imbalance: downside liquidation pressure appears comparatively limited, while upside price movement could rapidly convert into forced buying.
Why Short Liquidation Clusters Matter
In derivatives markets, liquidations do not occur passively. When short positions are liquidated, they are closed via market buy orders, which adds immediate upward pressure to price.
The structure shown on the chart implies that:
- Shorts are stacked aggressively above spot
- Liquidation thresholds are tightly clustered
- A sustained push higher could trigger chain-reaction liquidations
This type of setup often leads to non-linear price moves, where relatively small spot demand can produce outsized volatility due to leverage unwinding.
Market Implications Going Forward
The current positioning suggests Bitcoin is entering a zone where price direction matters more than momentum indicators. If BTC continues to range below $88K, short positions remain intact and pressure stays contained. However, a clean break higher would expose the market to forced deleveraging on the short side.
Importantly, the chart does not predict direction, it highlights where risk is concentrated. At present, that risk is skewed toward short sellers.
Final Takeaway
The Bitcoin liquidation map shows a market leaning heavily against upside continuation. With $7B in short liquidations stacked above current price, Bitcoin is positioned in a way where strength, not weakness, poses the greatest systemic risk to leveraged traders.
As long as BTC holds near this zone, traders should expect heightened sensitivity to upside moves, with the potential for rapid, liquidation-driven price expansion if key levels are breached.


