


Dogecoin is attracting renewed attention after a new analysis from Bitcoinsensus highlighted a repeating pattern of exponential upside moves across multiple cycles.
The chart suggests that each major rally has grown more aggressive than the last, raising questions about whether DOGE is preparing for another expansion phase.
Below is a look at the pattern, the historical wave structure, and what the latest price action shows.
Analysts Highlight DOGE’s Exponential Wave Structure
The analysis points to three major accumulation-and-breakout phases since 2021, each producing a sharp rally:
- First wave: approximately +190%
- Second wave: approximately +480%
- Potential third wave: estimated around +450%, if the structure repeats
Could a 0.75$ $DOGE be on the table?📈🔥#Dogecoin has been moving in exponential waves to the upside all throughout this cycle, with each move being more and more aggressive than the previous one. 💹
🔹First Move : +190%
🔹Second Move : +480%
🔹Third Move : +450%?… pic.twitter.com/Ptam4ELFam— Bitcoinsensus (@Bitcoinsensus) December 13, 2025
The chart from Bitcoinsensus positions the current market in the early phase of a third accumulation period. The framework argues that if DOGE were to follow this rhythm again, a test of new all-time highs sometime in early 2026 would fall within the historical behavior of its previous cycles.
The model is not a forecast, but it does illustrate a recurring tendency in Dogecoin’s long-term structure: gradual consolidation phases followed by steep, compressed expansions.
What the Chart Shows
The monthly cycle chart highlights three accumulation zones separated by explosive rallies. Each zone narrows before the next expansion, indicating increasing volatility compression. The latest structure shows DOGE rising along a curved trend path similar to the 2021 advance.
The price trajectory on the chart suggests a potential measured move into the $0.70–$0.75 zone if the curve continues, though this remains strictly pattern-based—no external assumptions are added.
DOGE’s Short-Term Price Action Remains Choppy
The separate 4-hour TradingView chart shows a different picture in the near term. DOGE is trading around $0.137, with intraday volatility and declining volume heading into mid-December.
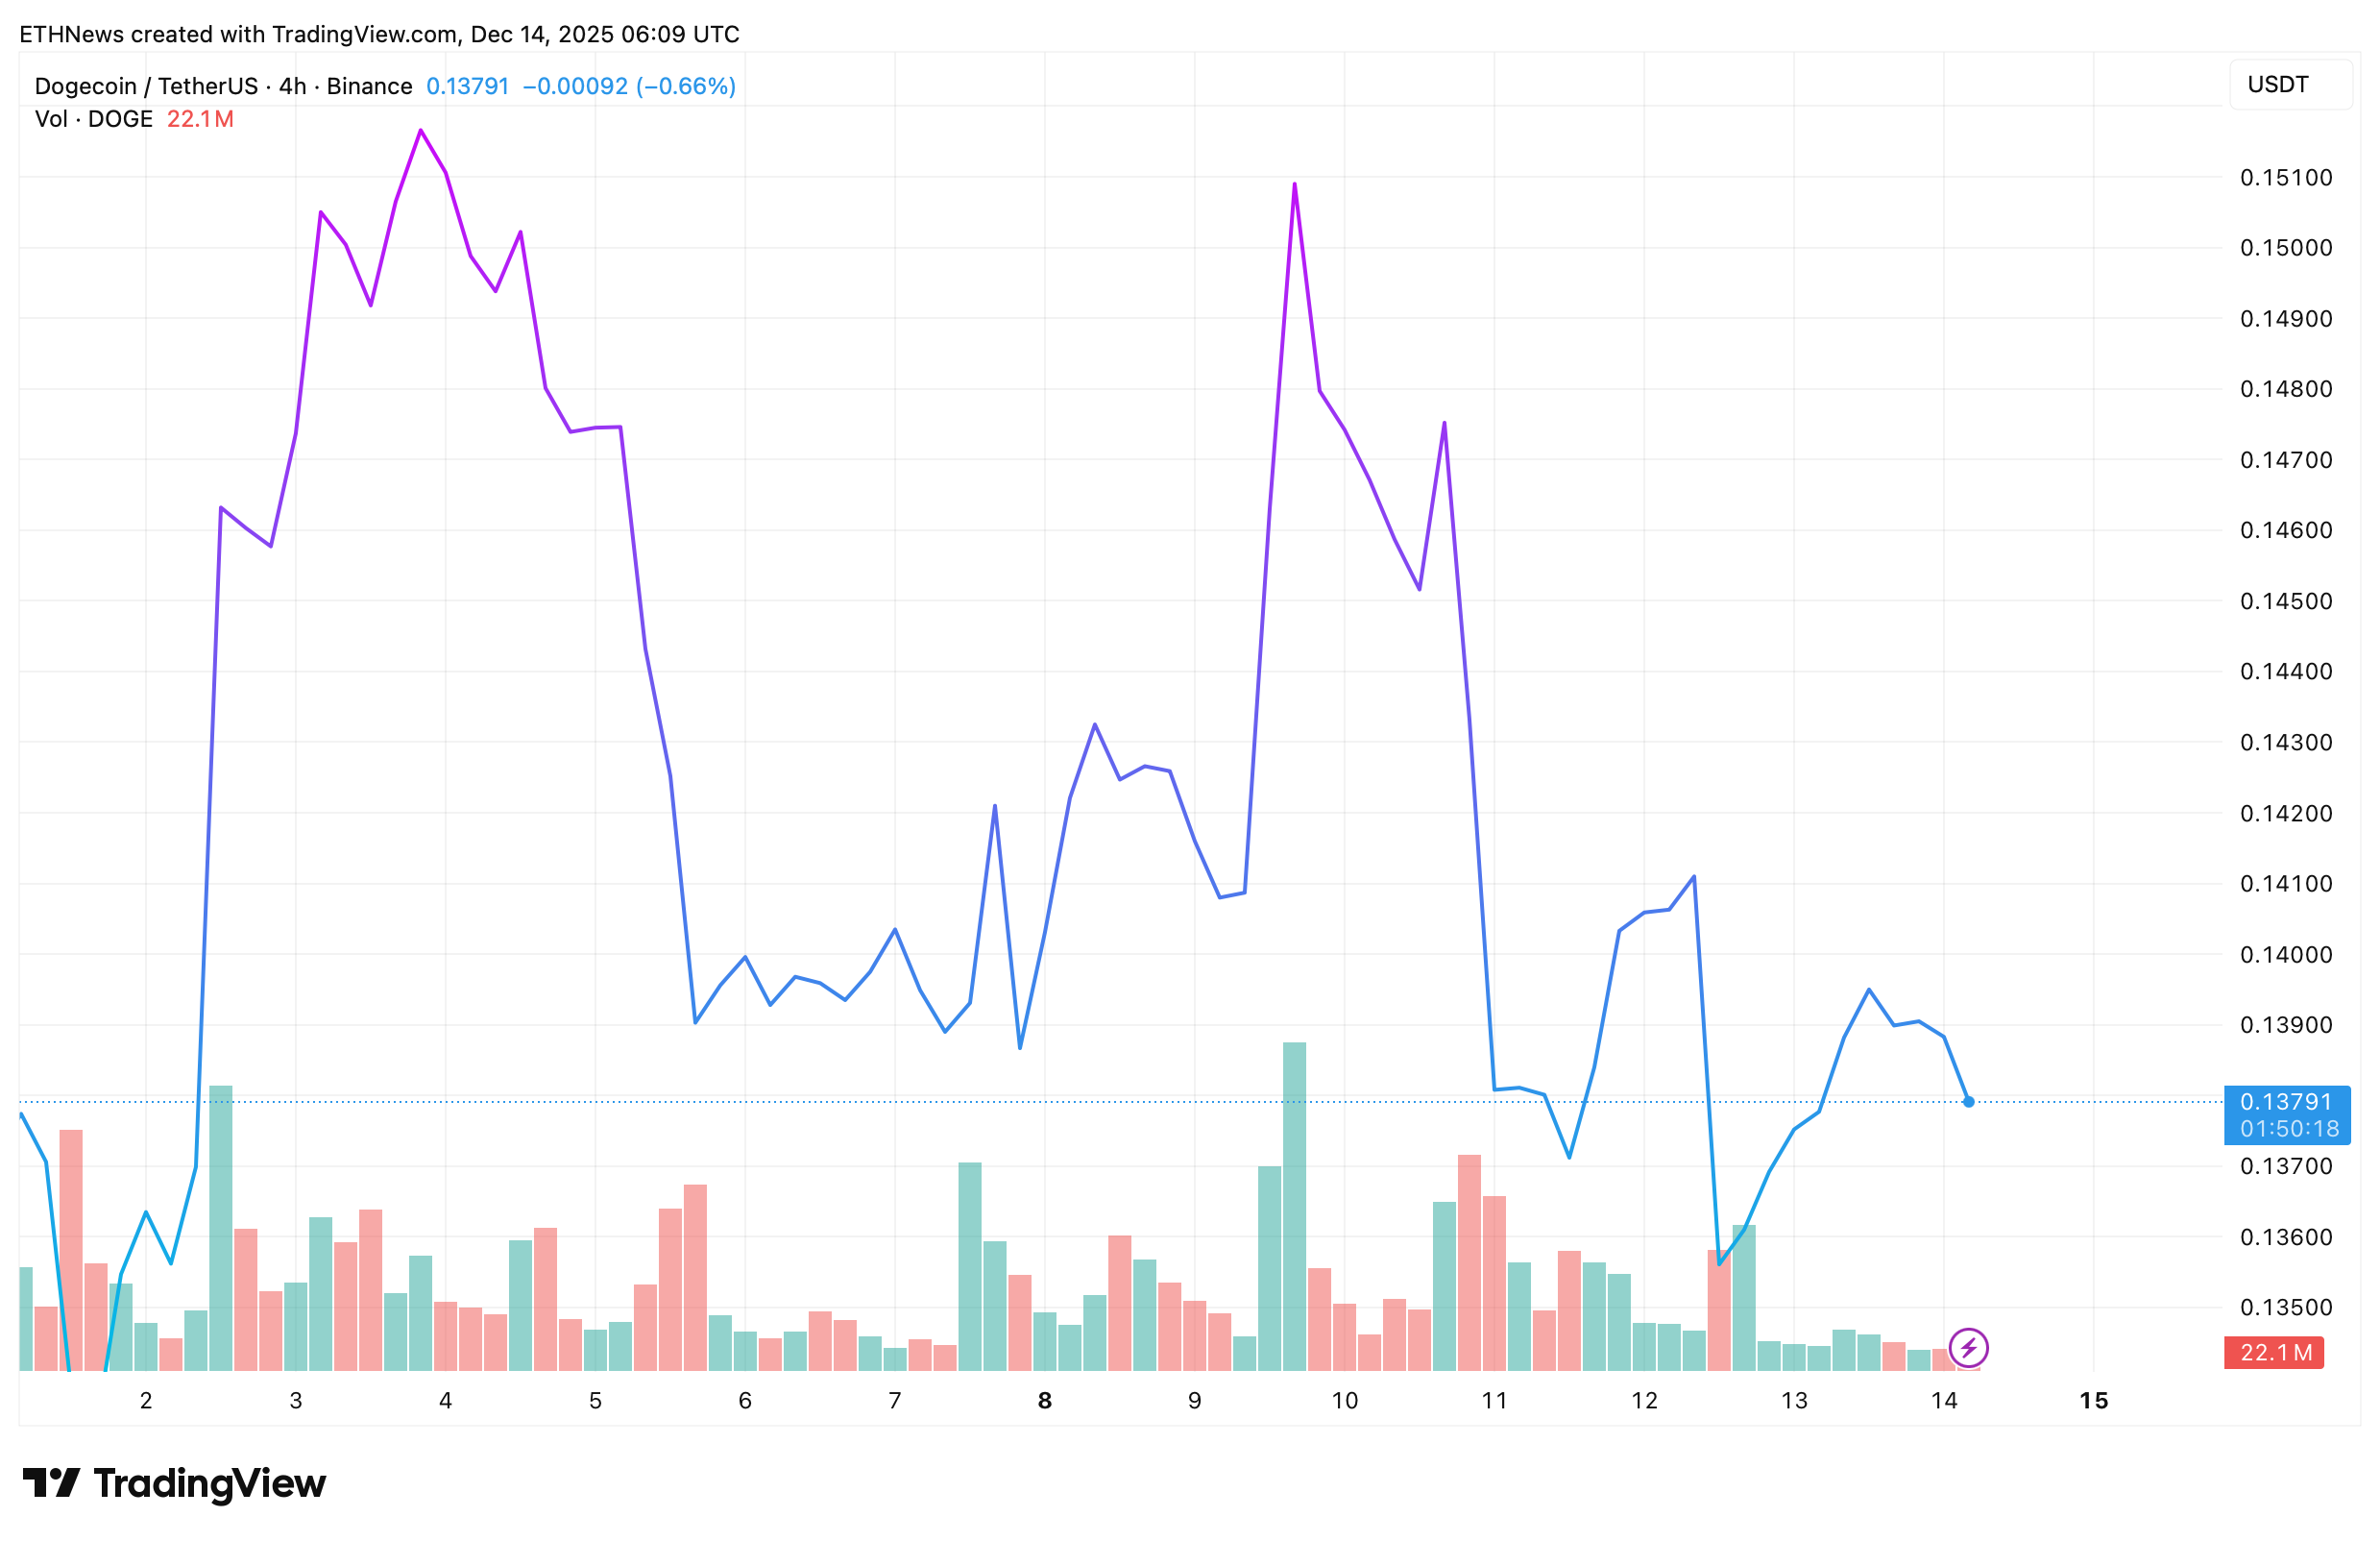
The chart indicates:
- A sharp swing near $0.15, followed by a pullback into the mid-$0.13** range
- Intermittent volume spikes rather than consistent accumulation
- A sideways trend forming beneath local resistance
This suggests that while long-term models point to a repeating structure, short-term sentiment remains indecisive.
A Potential Pattern, Not a Prediction
The broader takeaway is straightforward: Dogecoin has historically moved in sudden, outsized impulses after extended consolidation. The setup highlighted by analysts shows that the current structure resembles earlier phases, but confirmation would require a clean breakout supported by sustained volume.
For now, DOGE is holding its range, and traders are watching whether the pattern continues to build, or whether this cycle breaks from its historical rhythm.


